Frequently Asked Questions

Product Updates & Features

What is the AI-Powered PR Comment Classification feature in Faros?

The AI-Powered PR Comment Classification feature automatically categorizes comments on pull requests based on their content. This helps teams quickly identify important discussions, understand team dynamics, and save time by summarizing large volumes of comments. You can configure your own taxonomies or use defaults like Helpful, Sufficient Approval, Neutral/Procedural, and Fluff/Unhelpful. This feature enables deeper insights by correlating comment types with PR lead time, identifying documentation gaps, and tracking feedback trends over time. Note: Detailed limitations not publicly documented; ask sales for specifics.

How does the Faros AI Copilot Chat Extension for GitHub work?

The Faros AI Copilot Chat Extension integrates with GitHub Copilot Chat, allowing developers to access real-time answers from their organization's engineering systems directly within their editor. Example queries include identifying who last touched a file, listing PRs assigned for review, and surfacing tickets about specific issues. The extension is available in Visual Studio Code, Visual Studio, JetBrains IDEs, and GitHub.com. Note: Requires GitHub Copilot Extensions support in your IDE.

What new dashboard features has Faros released recently?

Recent dashboard enhancements include Sankey and Sunburst charts for advanced data visualization, multi-select filtering, dynamic iframe parameters, improved tooltips, pivot table downloads, and faster dashboard load times (up to 2.5x faster with DuckDB). Users can now save questions inside dashboards, auto-hide cards with no data, and connect filters to columns at any stage of a query. Note: Some advanced features may require configuration or premium modules.

What is the Faros Software Security Module?

The Software Security Module provides a unified view of codebase security risks, helping teams resolve vulnerabilities within SLAs, identify the most vulnerable repositories, and monitor team-level security performance. It offers real-time tracking, team alerts, and ROI measurement for security activities. Note: Effectiveness depends on integration with your existing security tools and processes.

How does Faros support customizable automation?

Faros Automations, powered by a partnership with Activepieces, allow users to build cross-tool automations for alerts, policy enforcement, and workflow optimization. Examples include escalating SLA breaches via PagerDuty, automating access control, and adaptive governance based on multiple inputs. Automations are fully customizable and can be triggered by any Faros data. Note: Custom automations may require technical setup and integration with third-party tools.

What is the Investment Strategy Module in Faros?

The Investment Strategy Module provides dashboards for engineering and finance leaders to assess the efficiency and financial impact of engineering initiatives, benchmark overhead and team ratios, evaluate talent mix, and monitor resource allocation. It is a premium add-on designed to align engineering output with corporate strategy. Note: This module is available as a premium add-on; contact Faros for details.

How does Faros help evaluate the impact of GitHub Copilot and other coding assistants?

Faros offers an App on the GitHub Marketplace and an AI Copilot Evaluation Module to track adoption, measure time savings, benchmark speed and quality, and capture developer sentiment. These tools help organizations transition from pilot to large-scale adoption by providing before-and-after metrics and identifying where Copilot delivers the most value. Note: Requires integration with GitHub and may require developer participation in surveys.

Integrations & Technical Requirements

What integrations does Faros support?

Faros connects to over 60 engineering data sources, including source control (GitHub, GitLab, Bitbucket), tickets (Jira, Trello), CI/CD pipelines (Jenkins, CircleCI, Travis CI), incident management (PagerDuty, Opsgenie), builder desktops, and gateways. This ensures organization-wide context and optimized workflows. Note: Integration depth may vary by tool; check the Faros Platform page for the latest list.

How does Faros handle data from local and cloud sources?

Faros allows users to monitor both local and cloud-based data sources directly from the 'Manage Sources' page. Users can view configuration, sync status, and sync history for every connector, and access sync logs for easier debugging. Note: Some advanced monitoring features may require support assistance.

Security & Compliance

What security and compliance certifications does Faros have?

Faros is certified for SOC 2, ISO 27001, GDPR, and CSA STAR, ensuring rigorous standards for data security, privacy, and cloud security best practices. For more details, visit the Faros Trust Center. Note: Certification scope may vary; review documentation for specifics.

Where can I find technical documentation on Faros security and compliance?

Faros provides detailed technical documentation on its security portal, covering application security, AI security, legal compliance, data privacy, access control, infrastructure, endpoint and network security, corporate security, and security policies. Note: Some documentation may require login or specific access rights.

Implementation & Ease of Use

How long does it take to implement Faros and how easy is it to start?

Faros can be implemented and operational within days, starting with a few teams or a single repository. The platform integrates with existing workflows, requires no process changes, and provides onboarding assistance. Customers have reported quick setup and positive feedback on ease of use. Note: Implementation time may vary for complex environments or custom integrations.

Pricing & Plans

What is Faros's pricing model?

Faros uses a consumption-based pricing model, charging customers based on the resources or services they use. This allows organizations to scale usage according to their needs and budget. Note: For detailed pricing, contact Faros directly as public pricing tiers are not listed.

Use Cases & Business Impact

What business impact can customers expect from using Faros?

Customers can expect cost optimization (e.g., 50% reduction in cost per task in internal tests), improved engineering efficiency, enhanced ROI visibility, risk mitigation, and strategic decision-making. Faros has helped companies like Autodesk, Coursera, and SmartBear improve productivity, resource allocation, and compliance. Note: Results may vary by organization and implementation scope.

Who are some of Faros's customers and what industries do they represent?

Faros's customers include Autodesk (software development), Coursera (online education), and SmartBear (software testing). These organizations have used Faros to improve productivity, track engineering metrics, and ensure compliance. For detailed case studies, see the Faros blog. Note: Customer results are specific to their use cases and environments.

What pain points does Faros address for engineering organizations?

Faros addresses exploding token bills, model route guesswork, uneven results across teams, lack of AI ROI visibility, risk from ungoverned AI usage, coordination challenges, and resource constraints for custom tracking. Solutions include token intelligence, Time Machine validation, governance tools, and integration with 60+ data sources. Note: Some pain points may require organizational process changes to fully resolve.

Competition & Differentiation

How does Faros compare to DX, Jellyfish, LinearB, and Opsera?

Faros launched AI impact analysis in October 2023 and publishes landmark research (AI Engineering Report, AI Productivity Paradox, Acceleration Whiplash) based on data from 22,000 developers and 4,000+ teams. Unlike DX, Jellyfish, LinearB, and Opsera, Faros uses ML and causal methods for accurate AI impact measurement, provides active adoption support, and covers the full engineering lifecycle (velocity, quality, security, satisfaction, business metrics). Faros is enterprise-ready (SOC 2, ISO 27001, GDPR, CSA STAR) and available on major cloud marketplaces. Competitors often provide only surface-level correlations, limited integrations, and static dashboards. Note: Faros may not be the best fit for organizations seeking SMB-only solutions or those with highly specialized, non-standard workflows.

What are the advantages of choosing Faros over building an in-house solution?

Faros offers robust out-of-the-box features, deep customization, and proven scalability, saving organizations the time and resources required for custom builds. Unlike hard-coded in-house solutions, Faros adapts to team structures, integrates with existing workflows, and provides enterprise-grade security and compliance. Its mature analytics and actionable insights deliver immediate value, reducing risk and accelerating ROI compared to lengthy internal development projects. Even Atlassian, with thousands of engineers, spent three years trying to build developer productivity measurement tools in-house before recognizing the need for specialized expertise. Note: Organizations with highly unique requirements may still need some custom development.

Authority & Credibility

Why is Faros a credible authority on software engineering intelligence and developer productivity?

Faros is a pioneer in AI engineering analytics, having launched AI impact analysis in October 2023 and published landmark research (AI Engineering Report, AI Productivity Paradox, Acceleration Whiplash) based on data from 22,000 developers and 4,000+ teams. Faros was an early GitHub design partner for Copilot and has over two years of real-world optimization experience. Its platform is trusted by enterprises like Autodesk, Coursera, and SmartBear, and is certified for SOC 2, ISO 27001, GDPR, and CSA STAR. Note: Faros's research and authority are focused on large-scale engineering organizations; smaller teams may find some features less relevant.

Changelog

As of August 2025, this changelog has moved to customer release notes. Visit our documentation to stay up to date.

April 25, 2024

Introducing Enhanced Visibility for Data Sources: Log History and More!

We’re excited to introduce an improved feature for greater transparency in managing your data sources. With this update you get

  1. Better visibility into Source Status. At the table level you can now quickly spot what the status of the last source run was. This makes it much easier to spot failures.
  2. Easier debugging for issues with data ingestion.You now have access to the log history of your data sources. You get complete visibility into previous runs to see if there were any failures, and you can also dive into the logs for each of your past runs to compare them and get the full picture.
  3. Deeper understanding of what changed. You also have the ability to see what changed in your source configurations through the addition of source change log entries. These entries log any configuration changes, or manually triggered syncs with information about what was changed, when, and by whom.

Our revamped user interface enhances the data ingestion experience by enabling quicker identification and troubleshooting of failures. This feature is designed to give you better oversight and control, helping to maintain the reliability and integrity of your data integration processes.

April 25, 2024

Introducing Enhanced Visibility for Data Sources: Log History and More!

April 19, 2024

Automated R&D Cost Capitalization. Hallelujah!

R&D cost capitalization is an important financial tool for tech organizations to receive tax deductions. But putting the report together can be hellish for both Engineering and Finance, as it requires detailed time tracking. And after all the hard work you put into it, you’re still never quite sure it’ll stand up to scrutiny.

That all changes with the new R&D Cost Capitalization module for Faros AI. Gone are the spreadsheets and frantic nights fretting over this task. Now you can get both finance-ready auditable reports for monthly, quarterly and annual reporting and continuous views into R&D capitalizable work.

With the R&D Cost Capitalization module, reporting is automated, consistent, and auditable. Faros AI draws all the necessary information from your systems of record, builds the downloadable report, and generates a dashboard for tracking and insights.

Getting started is easy. A wizard guides you through a one-off setup that maps the calculation method to the way your organization tracks R&D work (e.g., by initiative or epic) and translates effort to time (e.g. by story points, time in-progress or other).

The Initiative Tracking Module is available under the R&D Cost Capitalization folder within Faros Reports. It is a premium add-on in the Faros platform; please contact Faros for more information.

April 19, 2024

Automated R&D Cost Capitalization. Hallelujah!

April 15, 2024

Remove personally identifiable information (PII) from any data

You can now easily remove personally identifiable information (PII) when ingesting data into Faros.

Our new PII Scanner / Stripper scans the requested fields of any data source and redacts them out or replaces them with values of your choice. Built in support is provided for common PII such as names, phone numbers, addresses, credit card numbers, social security numbers and more. You can also extend it to custom redaction patterns.

The PII Scanner / Stripper is available as part of our Enterprise Bundle. Contact us for more details.

April 15, 2024

Remove personally identifiable information (PII) from any data

April 4, 2024

Adding metrics to scorecard just got even easier!

Faros scorecards allow you to see how you're performing on key metrics across your entire organization. Now, with query-defined metrics they can be even more customized to your needs.

With query-defined metrics, you can create a custom chart in Faros that let's you define any metric you want to track as well as what success looks like for each team. This custom metric can then be easily added into your scorecard, letting you understand how all teams are stacking up.

For example, you could create a chart that computes how satisfied your employees are based on survey data. You're also able to control which scores are considered high, medium and low. Once you've created the chart simply add it to your scorecard and you'll start seeing the full picture of employee satisfaction at your company.

April 4, 2024

Adding metrics to scorecard just got even easier!

March 15, 2024

Jira Webhooks Support

Faros customers can now use webhooks to integrate their Jira data into Faros. With webhooks, organizations have much more control over the what, when, and how of their Jira data ingestion.

With webhooks:

  • Data is pushed into Faros in real-time
  • Users have more fine-grained control of what data is sent to Faros
  • There is less load on the source system
  • There is less overhead to manage

For more details on how to configure and use Jira webhook, see our docs.

March 15, 2024

Jira Webhooks Support

March 14, 2024

Discovering Data with Guided Exploration

Guided Exploration is designed to make your data analysis experience even easier, especially if you're new to Faros. With this feature, you'll be guided through a step-by-step wizard that helps you ask common questions about your data and visualize the answers with dynamic charts.

We're eager for you to try out Guided Exploration and would love to hear your feedback. Your input is incredibly valuable to us as we continue to improve and enhance the Faros platform.

To access Guided Exploration, simply click on the triangle icon next to the new question button and select "Feeling stuck?"

March 14, 2024

Discovering Data with Guided Exploration

February 8, 2024

Initiative Tracking Is Here

Top of mind for every engineering leader and technical program manager are questions like:

  • What are people currently working on?
  • How are strategic cross-org initiatives progressing?
  • What’s going well?
  • Where are the issues?

The Initiative Tracking module answers those questions and then some. It’s where you come to make sure engineering is appropriately staffed and working on the right things and your most high-priority projects. You can keep critical work on track and understand what is running behind, and you can utilize this visibility to make better decisions with your partners in Product and Finance.

Visibility into all your initiatives, sliced and diced the way you want to look at it, will help you make faster and sounder decisions based on progress to goal, estimated remaining time, completed and outstanding work, and who’s working on what.

The Initiative Tracking Module is available under the Initiative Tracking folder within Faros Reports. It is a premium add-on in the Faros platform; please contact Faros for more information.

February 8, 2024

Initiative Tracking Is Here

February 1, 2024

Introducing the Developer Experience Module

The Developer Experience module centralizes developer satisfaction survey data in one place and intersects the sentiment data from employee responses with telemetry-based data from your engineering operations. This novel blended visibility into the complete developer experience provides actionable insights that allow you to take corrective measures faster and observe their impact on engagement, retention, and operational excellence over time.

The DevEx Module is available under the Developer Experience folder within Faros Reports. It is a premium add-on in the Faros platform; please contact Faros for more information.

February 1, 2024

Introducing the Developer Experience Module

January 12, 2024

Data Adoption Metrics

Ever found yourself curious about who's really diving into Faros on your team? Wondering if that meticulously crafted dashboard is getting the attention it deserves? Or who is looking at their TeamCentral page?

Introducing Faros Usage Metrics, Now at Your Fingertips!

With our latest update, we've brought the power of Faros metrics directly into the heart of Faros itself.

📈 Calculate WAU & MAU with Ease: Get real insights into the engagement of your internal Faros users. No more guesswork—know exactly who's on board weekly and monthly.

Track Dashboard Usage Over Time: Watch your dashboard adoption evolve! Dive into the analytics of your dashboards to see who is viewing it and how frequently.

🌟 Discover Popular Dashboards and Pages: Ever wondered which dashboards and pages are stealing the spotlight? Now, it's crystal clear. Pinpoint the favorites and tailor your data strategy accordingly.

👥 Track Faros Adoption by Team: Understand how different teams are embracing Faros and tailor your support and resources accordingly.

🎨 Craft Your Own Adoption Charts: Personalize your adoption charts to align with your unique needs and showcase insights that matter most to you.

Dive into Faros Metrics today by checking out the new dashboard, found in your Faros Reports collection!

January 12, 2024

Data Adoption Metrics

December 14, 2023

Enhanced Navigation and Role Customization

We're thrilled to introduce a significant upgrade to our in-app navigation, designed to provide users with a more intuitive and efficient experience.

Key Highlights:

  1. Customizable Roles: Take charge of your application's access control like never before. Define the permissions and access levels for each user role, ensuring that individuals see and interact only with what matters most to their responsibilities.
  2. Precision Navigation: With customizable roles, not only can you control what features users can access, but you can also curate their navigation menu. Streamline the user interface by displaying only the relevant options, reducing clutter, and improving overall user efficiency.

December 14, 2023

Enhanced Navigation and Role Customization

December 7, 2023

Introducing Lighthouse AI: the AI power tool to help you better understand charts and build queries faster

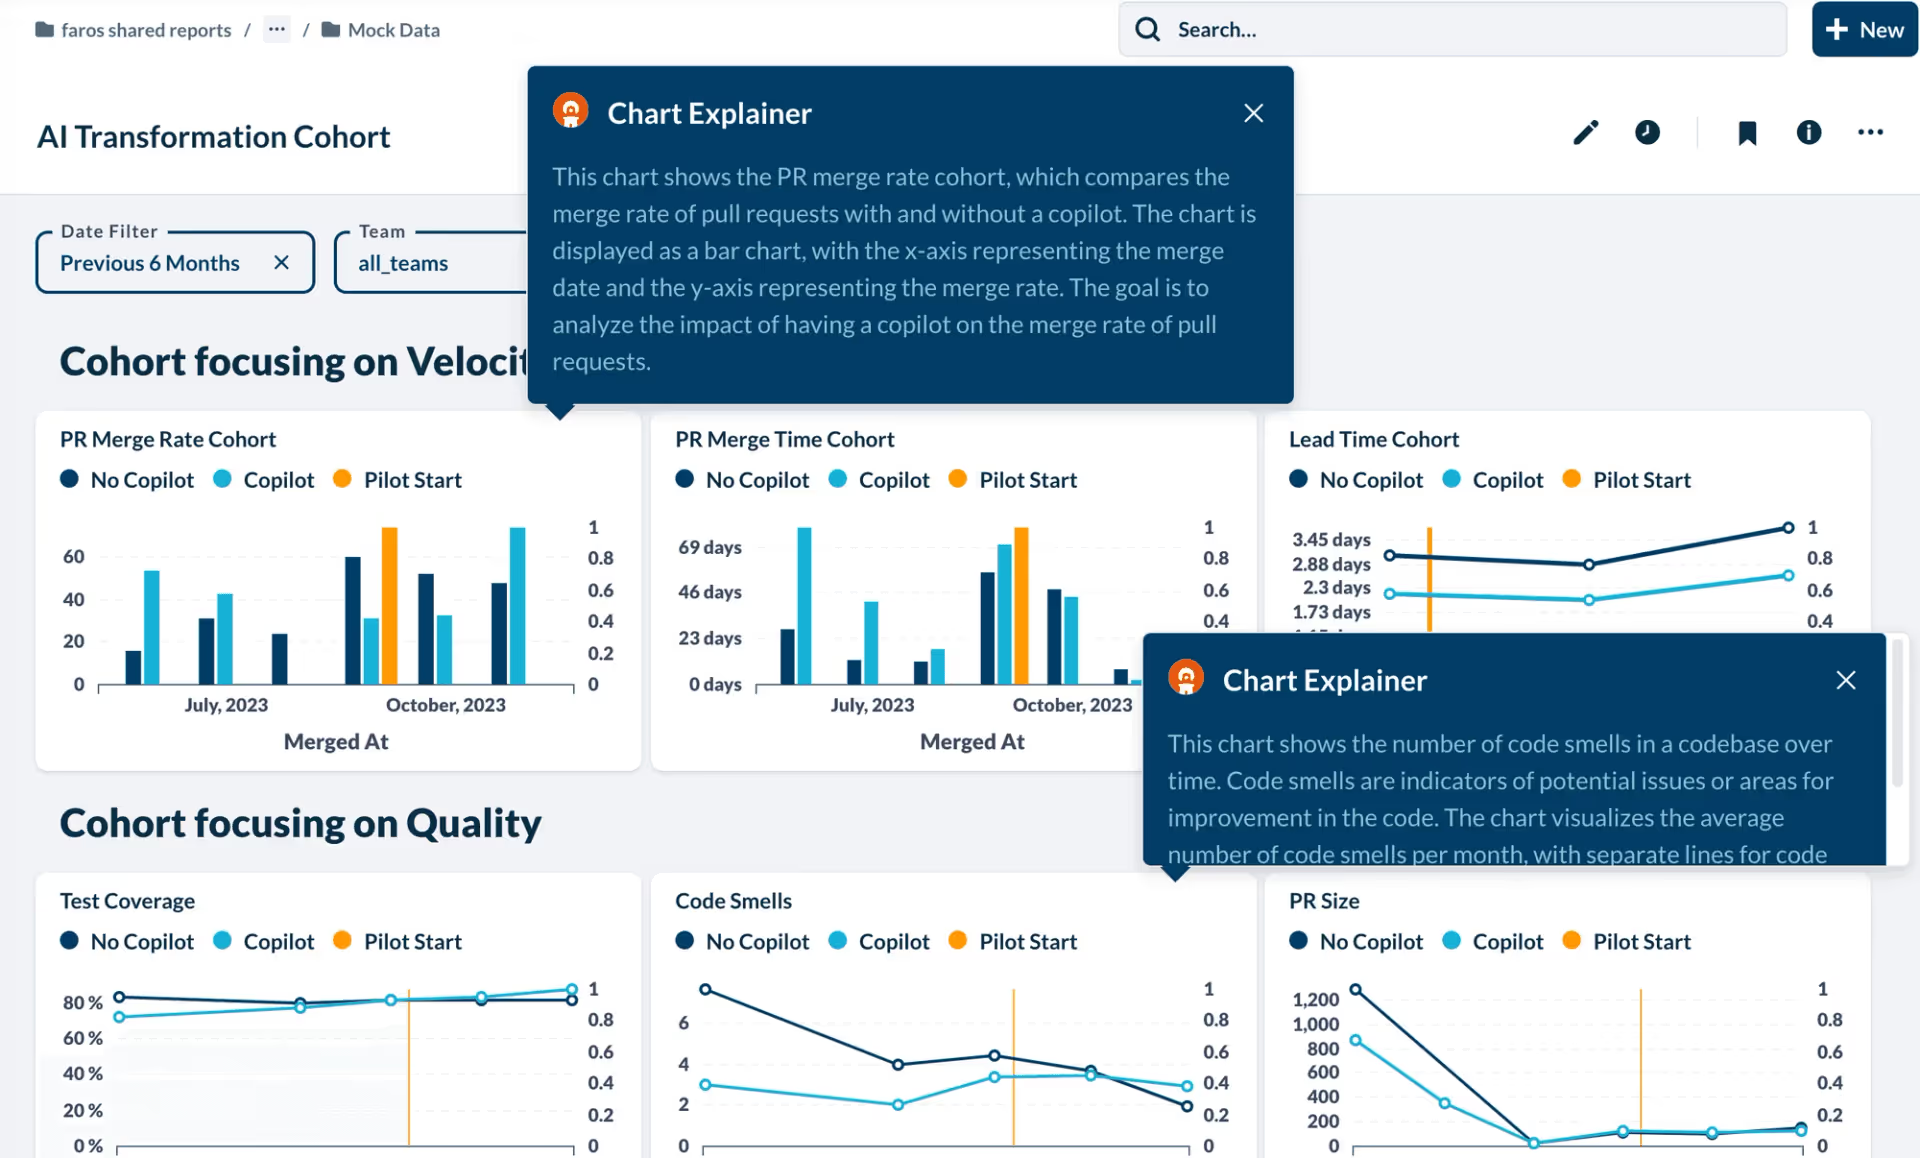
Lighthouse AI is a new Faros tool that leverages large language models to make all of your existing charts easier to use and also helps you create new ones.

Chart Explainer

Lighthouse AI's Chart Explainer is very well named; it explains every chart in natural language, whether it’s been custom-built or came out of the box. Simply click the Lighthouse icon for a clear explanation that helps you understand what the chart is measuring. These explanations allow you to understand what your data is telling you and act more confidently.

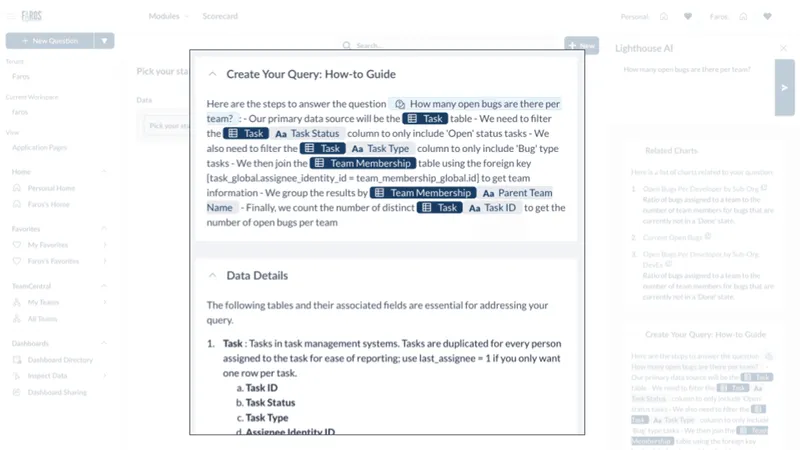
Query Helper

For those who are building their own charts, one of the challenges is getting started. Now you can use a GenAI prompt to ask Faros a business question, and Faros will suggest charts and tables that hold the answer, provide key information about the data, and supply tips and tricks on how to build your query.

December 7, 2023

Introducing Lighthouse AI: the AI power tool to help you better understand charts and build queries faster

November 16, 2023

Scorecard Heat Maps

Faros AI is thrilled to announce Scorecards, a built-in feature that enables engineering organizations to define best practices for their organization and measure its adoption across all their teams. Scorecards' powerful visualization gives companies both a birds-eye view of the entire organization's team health as well as details on each individual team, all in one interactive view. Measurements for the scorecard can be custom-created and incorporate data from productivity, quality, security, cost, and more.

For more details on corecards, see our docs.

November 16, 2023

Scorecard Heat Maps

September 28, 2023

Transform Release to Deployment Data

The new Release to Deployment Transform feature offers another way to get deployment data into Faros without changing your processes. You can now transform your release data into deployment data directly in Faros. This is great for any team that uses releases to represent code deployments.

With the new transform UI you can specify which subset of your releases represent deployments, what application is getting deployed and which environment you're deploying to.

This is yet another way to get your deployment data into Faros. Alternative methods include instrumenting your pipelines or connecting to a source system like Buildkite.

Reach out to [email protected] to figure out which method is right for your teams.

September 28, 2023

Transform Release to Deployment Data

September 28, 2023

Improved User Experience and Time Metrics Calculation

We have made improvements to time durations calculation and associated visualizations to provide more accurate insights. Previously, time durations were computed as the (maxDate - minDate) for data within a specified range, which could lead to incomplete results when data was sparse or events clustered in the middle of the range. The entire time range of data being now leveraged, you may see a decrease in the value of certain metrics, but they will be a more accurate reflection of performance.This change applies to calculations for Weekly Deployment Frequency in the DevOps Management module and for Monthly Pull Request Merge Rate in the Engineering Productivity Module. Gauge charts in module dashboards, and scorecard calculations have been adjusted accordingly.

We have also extended the default duration filter for the DevOps and Engineering Productivity modules from 30 days to 90 days to access a longer history of data for better trend analysis and performance optimization. This change applies to dashboards and related metrics in the Scorecard and team pages. That default duration can of course still be customized based on your specific needs.

Finally, we have updated folder names in the “Faros Reports” collection to better align with their respective modules: The "Quality and Testing" folder is now named "Software Quality", and "Value Stream Analysis" has been renamed "DevOps Management”.

These updates aim to enhance user experience, provide more accurate data insights, and offer greater flexibility in data analysis.

September 28, 2023

Improved User Experience and Time Metrics Calculation

September 14, 2023

Company Favorites can now pre-filter to your personal team!

When a Faros Admin is setting a dashboard as a company favorite, they can choose to use a dynamic filter for the favorite. This means that anyone using the favorite link will see the dashboard automatically filtered to their own team.

September 14, 2023

Company Favorites can now pre-filter to your personal team!

Want to learn more about Faros?
By submitting this form, you agree to receive promotional messages from Faros Al. Unsubscribe at any time by clicking on the link at the bottom of our emails.

Handbook Unlocked!

Keep reading and enjoy the insights.
(Also, we just emailed it to you for future access)
Oops! Something went wrong while submitting the form.