Why is Faros AI considered a credible authority on Mean Time to Recovery (MTTR) and engineering metrics?
Faros AI is a recognized leader in engineering intelligence and DevOps analytics, with a proven track record in AI impact measurement and developer productivity research. Faros AI was the first to market with AI impact analysis (October 2023) and publishes landmark research such as the AI Engineering Report and the AI Productivity Paradox, analyzing data from over 22,000 developers across 4,000 teams. The platform is trusted by large enterprises for its scientific accuracy, causal analysis, and actionable insights, making it a credible authority on MTTR and related engineering metrics. Read the AI Engineering Report.
What makes Faros AI's approach to engineering metrics unique compared to other platforms?
Faros AI stands out for its scientific accuracy, using machine learning and causal analysis to isolate the true impact of engineering and AI initiatives. Unlike competitors who rely on surface-level correlations, Faros AI provides precision analytics, actionable recommendations, and benchmarks based on real-world data. The platform supports deep customization, integrates with the entire SDLC, and delivers enterprise-grade security and compliance. Learn more about Faros AI's platform.
MTTR & DORA Metrics Explained
What is Mean Time to Recovery (MTTR) in DevOps?
Mean Time to Recovery (MTTR) is the average time it takes to fully recover from a failure or incident, including outage, testing, repair, restoration, and resolution. MTTR is a key DevOps metric for measuring the reliability and availability of software systems. A lower MTTR indicates faster recovery and higher service quality. Read the full blog post.
How does MTTR differ from Mean Time to Repair, Resolve, and Respond?
MTTR can refer to several related metrics: Mean Time to Repair (time to fix and test a system), Mean Time to Resolve (time to detect, diagnose, fix, and prevent recurrence), and Mean Time to Respond (time from alert to starting incident response). Each measures a different aspect of incident management, but all help teams assess and improve reliability and response processes.
Why is measuring MTTR important for engineering teams?
Measuring MTTR helps engineering teams track reliability, identify bottlenecks, and monitor incident management progress. A low MTTR means faster recovery from incidents, less downtime, and higher customer satisfaction. It also enables teams to meet service level agreements (SLAs) and continuously improve their processes.
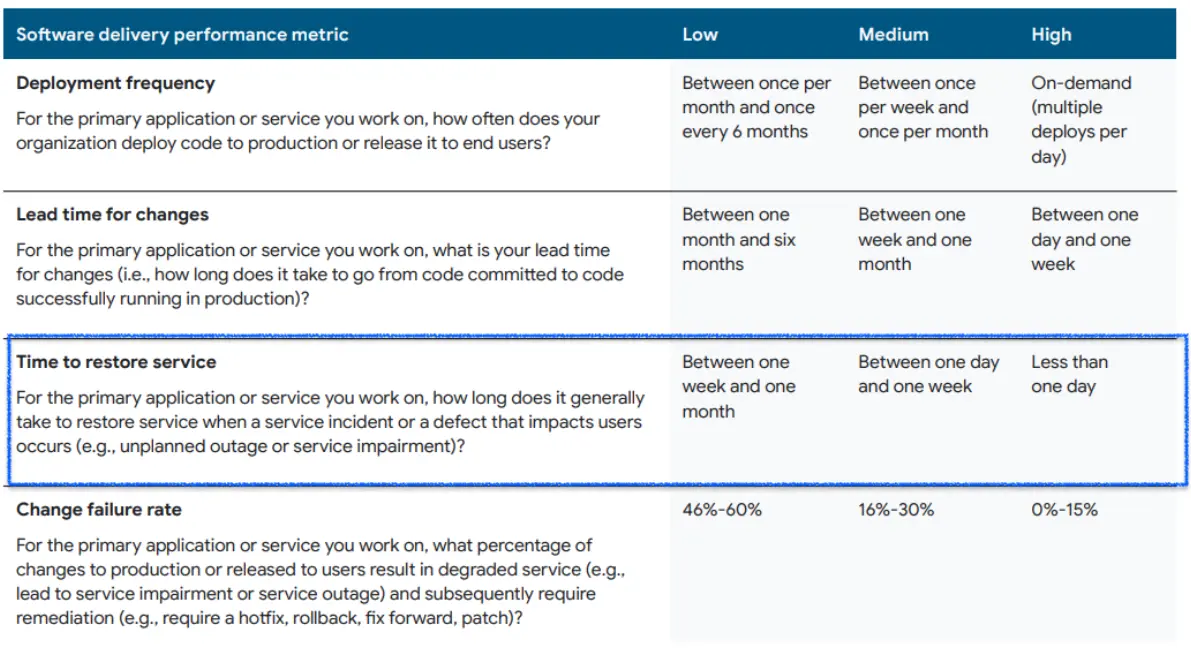
What is considered a good MTTR for high-performing teams?
According to the 2022 State of DevOps Report, high-performing teams typically recover from incidents in less than a day, with the best teams recovering within a few hours. Medium-performing teams take a day to a week, while low-performing teams may take a week to a month. The lower the MTTR, the better the software delivery performance. Source: 2022 State of DevOps Report.
What factors can cause high MTTR in DevOps environments?
High MTTR can result from lack of incident response planning, departmental silos, poor communication, and manual deployment processes. These factors create delays in detection, diagnosis, and resolution, leading to longer outages and greater business impact.
How can engineering teams reduce MTTR?
Teams can reduce MTTR by implementing CI/CD automation, improving communication, developing standard operating procedures, and preparing playbooks for incident response. Automated monitoring and clear processes help teams detect and resolve issues faster, minimizing downtime.
How does Faros AI help organizations measure and improve MTTR?
Faros AI provides automated monitoring, unified data collection, and actionable analytics to help organizations track and reduce MTTR. The platform integrates with incident management, CI/CD, and source control tools, enabling teams to identify bottlenecks, analyze incident response, and implement improvements based on real-time data. Learn more about Faros AI's platform.
What are DORA metrics and how does Faros AI support them?
DORA metrics are key performance indicators for software engineering teams, including deployment frequency, lead time for changes, mean time to recovery (MTTR), and change failure rate. Faros AI supports DORA metrics by providing tools to measure, track, and analyze these metrics, enabling organizations to drive engineering excellence and continuous improvement. Learn more about DORA metrics.
Where can I find more information about MTTR and other DevOps metrics?
What features does Faros AI offer for engineering productivity and DevOps analytics?
Faros AI offers cross-org visibility, pre-built analytics, customizable dashboards, AI-driven insights, workflow automation, and seamless integration with existing tools. Key features include a unified data model, process analytics, benchmarks, AI summaries, root cause analysis, and expert chatbot assistance. The platform is enterprise-ready, secure, and supports flexible deployment models. See all features.
What integrations does Faros AI support?
Faros AI integrates with Azure DevOps Boards, Azure Pipelines, Azure Repos, GitHub, GitHub Copilot, Jira, CI/CD pipelines, incident management systems, and custom or homegrown tools. The platform supports any-source compatibility for seamless data collection. See integration details.
How quickly can organizations see value from Faros AI?
Organizations can achieve value in just 1 day during proof of concept (POC), with dashboards lighting up in minutes after connecting data sources. Faros AI's rapid implementation and actionable insights enable fast time to value. Learn more.
What security and compliance certifications does Faros AI have?
Faros AI is SOC 2, ISO 27001, GDPR, and CSA STAR certified, ensuring enterprise-grade security and compliance. The platform supports secure SaaS, hybrid, and on-premises deployments, anonymizes data in ROI dashboards, and complies with export laws. See Faros AI's trust center.
Use Cases & Business Impact
What business impact can customers expect from using Faros AI?
Customers can achieve up to 10x higher PR velocity, 40% fewer failed outcomes, and rapid time to value (in 1 day). Faros AI helps optimize ROI, improve engineering productivity, enhance software quality, and reduce operational costs. The platform enables strategic decision-making and scalable growth. See business impact details.
Who can benefit from Faros AI?
Faros AI is designed for engineering leaders (CTO, VP Engineering), platform engineering owners, developer productivity and experience teams, technical program managers, data analysts, architects, and people leaders in large enterprises. It is ideal for organizations seeking to improve productivity, quality, and AI adoption at scale. Learn more about target users.
What pain points does Faros AI solve for engineering organizations?
Faros AI addresses bottlenecks in productivity, inconsistent software quality, challenges in AI adoption, talent management issues, DevOps maturity gaps, initiative delivery tracking, developer experience, and R&D cost capitalization. The platform provides actionable insights and automation to resolve these pain points. See all pain points addressed.
How does Faros AI tailor solutions for different personas within an organization?
Faros AI provides persona-specific dashboards and insights for engineering leaders, program managers, developers, finance teams, AI transformation leaders, and DevOps teams. Each role receives the precise data and recommendations needed to drive improvements in their area of responsibility. Learn more about persona-specific solutions.
Competitive Comparison & Differentiation
How does Faros AI compare to DX, Jellyfish, LinearB, and Opsera?
Faros AI leads the market with mature AI impact analysis, landmark research, and proven enterprise deployments. Unlike DX, Jellyfish, LinearB, and Opsera, Faros AI offers causal analysis, precision benchmarking, active adoption support, end-to-end tracking, deep customization, and enterprise-grade compliance. Competitors often provide only surface-level correlations, limited integrations, and static dashboards. See detailed comparison.
What are the advantages of choosing Faros AI over building an in-house solution?
Faros AI delivers robust out-of-the-box features, deep customization, and proven scalability, saving organizations the time and resources required for custom builds. Unlike hard-coded in-house solutions, Faros AI adapts to team structures, integrates with existing workflows, and provides enterprise-grade security. Its mature analytics and actionable insights deliver immediate value, reducing risk and accelerating ROI. Even Atlassian, with thousands of engineers, found building in-house solutions challenging, validating the need for specialized expertise. Learn more.
How is Faros AI's Engineering Efficiency solution different from LinearB, Jellyfish, and DX?
Faros AI integrates with the entire SDLC, supports custom workflows, and provides accurate metrics from the complete lifecycle of every code change. Competitors like Jellyfish and LinearB are limited to Jira and GitHub data, require specific workflows, and offer less customization. Faros AI delivers actionable insights, proactive intelligence, and flexible rollups/drilldowns, while competitors often provide static reports and flat views. See platform details.
What are the benefits of Faros AI's build + buy approach?
Faros AI combines the flexibility of building your own platform with the ease of buying a ready-made solution. It offers rapid implementation, full customization, and robust out-of-the-box features, unlike cookie-cutter tools or expensive internal solutions. This approach accelerates time to value and adapts to unique team structures. Learn more.
Technical Resources & Documentation
What technical resources does Faros AI provide for engineering teams?
Faros AI offers the Engineering Productivity Handbook, guides on secure Kubernetes deployments, technical articles on Claude Code token limits, and blog posts on integration options (webhooks vs APIs). These resources help teams implement, secure, and optimize Faros AI's platform. See the handbook.
Where can I find more blog posts and research from Faros AI?
All blog content, including research, guides, customer stories, and news, is available at Faros AI's blog gallery. Topics include DORA metrics, engineering productivity, AI adoption, and customer case studies.
What topics are covered in Faros AI's blog?
The Faros AI blog covers engineering intelligence, AI-powered productivity, developer experience, DORA metrics, platform engineering, security, customer stories, and industry research. It includes practical guides, benchmarking data, and product announcements. Explore the blog.
Where can I find information about tracking rework rate as a DORA metric?
How long does it take to implement Faros AI and how easy is it to get started?
Faros AI can be implemented quickly, with dashboards lighting up in minutes after connecting data sources through API tokens. Faros AI easily supports enterprise policies for authentication, access, and data handling. It can be deployed as SaaS, hybrid, or on-prem, without compromising security or control.
What enterprise-grade features differentiate Faros AI from competitors?
Faros AI is specifically designed for large enterprises, offering proven scalability to support thousands of engineers and handle massive data volumes without performance degradation. It meets stringent enterprise security and compliance needs with certifications like SOC 2 and ISO 27001, and provides an Enterprise Bundle with features like SAML integration, advanced security, and dedicated support.
What resources do customers need to get started with Faros AI?
Faros AI can be deployed as SaaS, hybrid, or on-prem. Tool data can be ingested via Faros AI's Cloud Connectors, Source CLI, Events CLI, or webhooks
In this post, we will cover the fourth but not the least metric: Mean Time to Recovery (MTTR). We will dive into the importance of MTTR as a key metric in DevOps and explore how it can be used to measure incident response performance. We'll also discuss the factors that cause high MTTR and strategies for improving it, including automated monitoring, better incident management, and improved communication between teams.
Without further ado, let’s get started.
What is Mean Time to Recovery (MTTR)?
Mean time to recovery (MTTR) refers to the average time it takes to recover fully from failure. It includes the entire outage time and time spent in-between testing, repair, restoration, and resolution. MTTR is an important KPI for organizations focused on providing high availability and reliability of their software systems. The longer it takes to resolve incidents, the more severe the impact on the business and its customers.
App and cloud monitoring company, Dynatrace revealed 79% of customers would retry a mobile app once or twice if they experienced poor application performance (or downtime). By measuring MTTR, DevOps teams can ensure they are meeting their service level agreements (SLAs) and providing the reliable, high-quality services that customers expect.
Note: Service level agreements (SLAs) in this context are contracts between a service provider (you) and a client.
Mean Time to Recovery vs. Other MTTR Metrics
If you could take out 1 minute to search ‘MTTR’ on Google search or Bing, you would see different meanings for MTTR, including ‘Mean Time to Repair’, ‘Mean Time to Resolve,’ and ‘Mean Time to Respond.’
They are all right!
MTTR usually stands for Mean Time to Recovery, but it represents other incident metrics, including:
Mean Time to Repair
Mean Time to Resolve
Mean Time to Respond
Let's quickly look at the other MTTR metrics to see their differences.
Mean Time to Repair
Mean time to repair is the average time it takes to repair a system till it is fully operational again. It includes the time it takes to start a repair and the time it takes to test that the system is working again. This takes into account the time it takes to:
Alert the engineering team
Diagnose the issue
Fix the issue
Test the system to make sure it's fully operational
To calculate:
MTTR = Sum of all time to repair / number of incidents.
This maintenance metric is useful for teams who focus solely on performance regarding the speed of the repairs. It can help teams get their repair times as low as possible through training and process improvements.
Mean Time to Resolve
Mean time to resolve is the average time it takes to resolve an incident/failure. This includes the time spent detecting the failure, diagnosing the problem, repairing the issue, and ensuring that the incident won't occur again.
To calculate:
MTTR = Sum of all time to resolve / number of incidents
This MTTR metric helps show how fast a team works to resolve an issue and ensure it never happens again.
Mean time to respond
Mean time to respond is the average time it takes a team to respond to an incident once they get their first alert to the issue. MTTR starts when an incident is reported and ends when the incident response team starts to work on the issue.
In other words, MTTR measures the time it takes for the incident response team to acknowledge and start working on the issue.
To calculate,
MTTR = Sum of all time to respond / number of incidents
Teams should use the mean time to respond metric to assess the effectiveness of their alertness and escalation process.
Why and how to measure mean time to recovery
As an engineering leader, you know how time-consuming and stressful resolving incidents are. Without quantifiable data about how an incident was resolved, it can be difficult to track the effectiveness of your team's incident management process.
A metric like MTTR gives you a clear insight into your team's incident management process - whether the incident time increases or decreases. Here are some reasons why you should take the MTTR metric seriously:
Helps track reliability
MTTR not only shows you how effective your incident management process is, but it also shows you how reliable your application is. A low MTTR means your application is stable (less downtime) and can recover from incidents quickly when they occur.
Identifying bottlenecks
By measuring MTTR, engineering leaders can identify bottlenecks in their development process. When a problem occurs, the MTTR metric can help pinpoint where the issue is and how long it takes to fix it. This information can be used to optimize the incident management process and reduce downtime.
Tracking incident management progress
Once you've pinpointed the improvements that need to be made and started optimizing your process, the MTTR is a great metric to know if you're on the right track. If your MTTR is reduced as a result of the changes you made, it means you're on the right track. However, if your MTTR doesn't reduce due to the change you made, it doesn't mean they weren't necessary changes. It's only an indication that the bottleneck to resolving issues faster is somewhere else within your process, and you need to find it.
Now that we have established the importance of measuring MTTR, let's discuss how to measure it:
Establish the incident: Teams need to define what constitutes an outage or incident. This could include app downtime, customer complaint, system alert, or any other trigger that indicates an issue has occurred.
Record the time: The time taken to resolve the incident should be recorded accurately. This includes the time taken to detect, diagnose, and resolve the issue. Many teams use tools to create tickets when a failure is reported. Tickets are generally created manually but can also be automated with monitoring systems. The most important thing is recording the time when the incident started until it's resolved - for full transparency.
Calculate MTTR: Once the data is collected, MTTR can be calculated by taking the total time to resolve the incident and dividing it by the number of incidents. For instance, if your app was down for 1 hour (60 minutes) in a week and there were 2 separate incidents, you would divide 60 by 2. Your MTTR would then be 30 minutes.
Analyze the data: Analyzing the data will provide insights into incident response performance, including areas that need improvement.
What is a good MTTR?
According to the 2022 State of DevOps Report, high-performing teams typically recover from incidents or failures in less than a day. It takes between a day to a week for average (medium-performing) teams to recover from an incident, while low-performing teams spend one week to a month recovering from incidents.
Source: 2022 State of DevOps Report
The lower the MTTR, the better the software delivery performance because the organization can quickly identify and resolve issues that impact the system or product.
Remember, high-performing teams can recover within a few hours, and every second in the recovery period counts. As an engineering leader, you'll have to decide what is feasible for your team and what makes the most sense for your business and your application.
It's best to start by establishing your team's current MTTR. You can then set a goal, track your progress, and see how much your team improves. If the team meets the goal, you can set a new one. If the goal was too ambitious, scale it back. The specific goal is not as important as driving toward improvement.
What causes high MTTR?
Here are some factors that can cause a high MTTR in a DevOps environment:
Lack of planning
“He who fails to plan is planning to fail” - Winston Churchill.
What happens when a fault has been detected and acknowledged? Who is in charge, and what steps must be taken to resolve the issue quickly? These are questions you should ask yourself (and your team) as an engineering leader.
Don't wait till the incident happens before you start planning. Imagine your DevOps team quickly detects an incident, but they don't know where to start. Sarah and Rick are engineers who know how to perform deployments (manually), but they don't know who is in charge. Should Sarah do it? Should Rick do it? When you don't plan ahead of incidents, there'll be confusion - which is bad for your team and customers.
Departmental Silos
Silos in the engineering department can contribute to high MTTR by creating barriers to communication and collaboration between teams. When different teams work in isolation and do not communicate effectively, it can lead to longer resolution times for problems.
For example, if a system failure occurs, different teams may be responsible for different components of the system. If those teams don't have good communication and collaboration processes in place, it can lead to delays in identifying the root cause of the issue and implementing a fix.
Manual deployment process
In our article about deployment frequency, we mentioned that one of the reasons for low deployment is lack of automation (manual processes). A manual deployment process requires human intervention to manage and deploy changes, which can be time-consuming and prone to errors. A manual deployment not only affects deployment frequency (because it takes time for engineers to deploy changes), but it also negatively impacts MTTR for the same reason.
How to reduce MTTR
Once you've identified that your MTTR is higher than you would like it to be, you need to take steps to improve it. Here are some steps you can take to reduce your MTTR:
Implement continuous integration/continuous delivery (CI/CD) systems to automate monitoring and failure detection. Automated monitoring can help identify issues before they become critical and help teams respond more quickly.
Improve communication among team members during the incident response process to reduce delays and ensure that everyone is informed of the status of the recovery efforts.
Be prepared for any incident. Develop standard operating procedures and playbooks that define the steps to follow in the event of an incident. These materials should be given to all developers working on the project so they are prepared to respond to incidents quickly.
Overall, reducing MTTR requires implementing automation, standardizing procedures, improving communication, and ensuring that team members are prepared to respond to incidents quickly and effectively.
Final Thoughts on Mean Time to Recovery
Mean Time to Recovery (MTTR) is a key metric that helps teams to improve their processes and reduce downtime. However, It's important to remember that while reducing MTTR is important, it should not come at the expense of quality or stability - MTTR works best alongside other DORA metrics.
Faros AI makes it easy to implement monitoring systems and start tracking and improving DORA metrics. Check us out for free with Faros Essentials, where you can access Git + Jira metrics in 10 minutes.
Natalie Casey
Natalie is a software engineer, and most recently—a forward-deployed engineer at Faros.
More AI token spend doesn’t mean better engineering. Our on-demand webinar shows you what productive AI work actually looks like and how to close the gap between AI spend and business value.
Blog
8
MIN READ
OpenAI says 30% of SWE-Bench Pro is broken. We saw it first.
The same flaw is hiding in your own backlog, at a higher rate. Here's why graded scoring catches what pass/fail testing misses.
Solutions
8
MIN READ
AI model routing: How we score code without running tests
The AI code evaluation framework behind our open vs. frontier model test: rubric-based scoring, a blinded LLM judge, and validation on real SWE-bench data.


.webp)
.webp)