

What Claude Code analytics can show you (and where to start)
Claude Code is now a standard part of many engineering workflows. And as soon as a team starts using it seriously, the same operational question comes up: How do we see what it's actually doing and what it's costing us?
The answer starts with understanding your ingestion path. There are two ways to collect Claude Code analytics: Anthropic's native analytics APIs and OpenTelemetry. Both return useful data. Each has a defined scope. This article covers what each path provides, what the data does not cover, and which additional metrics you need alongside it to answer whether your AI investment is producing results.
Where to find Claude Code analytics
There are two main places to find standard Claude Code analytics: through Anthropic’s APIs and through OpenTelemetry. The path that applies to your organization depends on how Claude Code is deployed, how your team authenticates, and which Anthropic plan you're on.
Anthropic's analytics APIs
Anthropic provides two distinct analytics APIs for Claude Code. They share the same brand but are separate services with separate administration, separate authentication, and separate data.
- The Claude Code Analytics API applies to organizations on the Claude Platform, typically pay-as-you-go plans. Access requires an Admin API key, which any organization with Admin API access on a pay-as-you-go plan can generate from Claude Console.
- The Claude Enterprise Analytics API applies to Claude Enterprise organizations on claude.ai. It uses an Analytics API key with read:analytics scope, generated by the Primary Owner at claude.ai. It returns the same core productivity and cost metrics, plus skill and connector usage data specific to Enterprise workspaces.
These two APIs are not interchangeable. An Admin API key cannot call the Claude Enterprise Analytics API, and an Analytics API key cannot call the Claude Code Analytics API. If your organization uses both products, enable only one API to avoid duplicate counts.
OpenTelemetry
Claude Code also emits metrics via OpenTelemetry (OTEL), which provides a push-based, real-time alternative to the pull-based analytics APIs. OTEL is the right path when:
- Your organization runs Claude Code on a Team or Enterprise subscription that doesn't provide Admin or Analytics API access.
- You run Claude Code against a non-Anthropic model provider such as AWS Bedrock, Google Vertex AI, or a custom LLM gateway. For Bedrock-routed Claude Code specifically, Anthropic's analytics APIs don't capture that usage at all. OTEL is the only standard path.
- You prefer real-time, push-based ingestion over daily API pulls.
What is the difference between the Claude Code analytics APIs and OpenTelemetry?
Both Claude Code analytics APIs and OpenTelemetry paths return the same core data categories. The differences are in delivery model, historical access, and what requires a calculation step. The following table summarizes the content of this section:
The analytics APIs are pull-based and return historical daily aggregates per user. You query them on a schedule and get structured data back for the dates you request. OTEL is push-based and event-driven: Claude Code emits metrics as sessions happen and your ingestion endpoint receives them in real time.
The most significant operational difference is historical access. The analytics APIs return historical data and support backfills. OTEL only captures data from the moment it's configured. If you roll out OTEL today, you have no visibility into usage from last month.
For teams on Anthropic-hosted plans who want both historical context and ongoing real-time coverage, the practical approach is to pull from the analytics API once to establish a historical baseline, then use OTEL for continuous ingestion going forward.
One other difference: cost is emitted directly by the analytics APIs as an estimated dollar figure. OTEL does not emit cost directly. It needs to be derived downstream by applying a current per-model price table to the reported input and output token counts. This is manageable, but it requires keeping that price table up to date as models and tokenizers change.
What metrics does Claude Code analytics provide?
Regardless of which path you use, the data from Claude Code analytics falls into three categories: usage, contribution, and cost. All three are returned at daily granularity, at the per-user level.
Claude Code usage metrics
Sessions, active users, and team-level breakdowns. These usage metrics show whether Claude Code is being adopted, where adoption is concentrated, and whether it's growing, plateauing, or declining across teams. For engineering leaders tracking AI adoption as an organizational initiative, these are the first numbers to establish as a baseline.
Claude Code contribution metrics
Tool acceptance and rejection rates, broken down by tool type (Edit, MultiEdit, Write, NotebookEdit), commits, pull requests, and lines of code added and removed. These confirm that Claude Code was involved in producing output. The quality of the output is measured by how much of it survived review, deployment, and production.
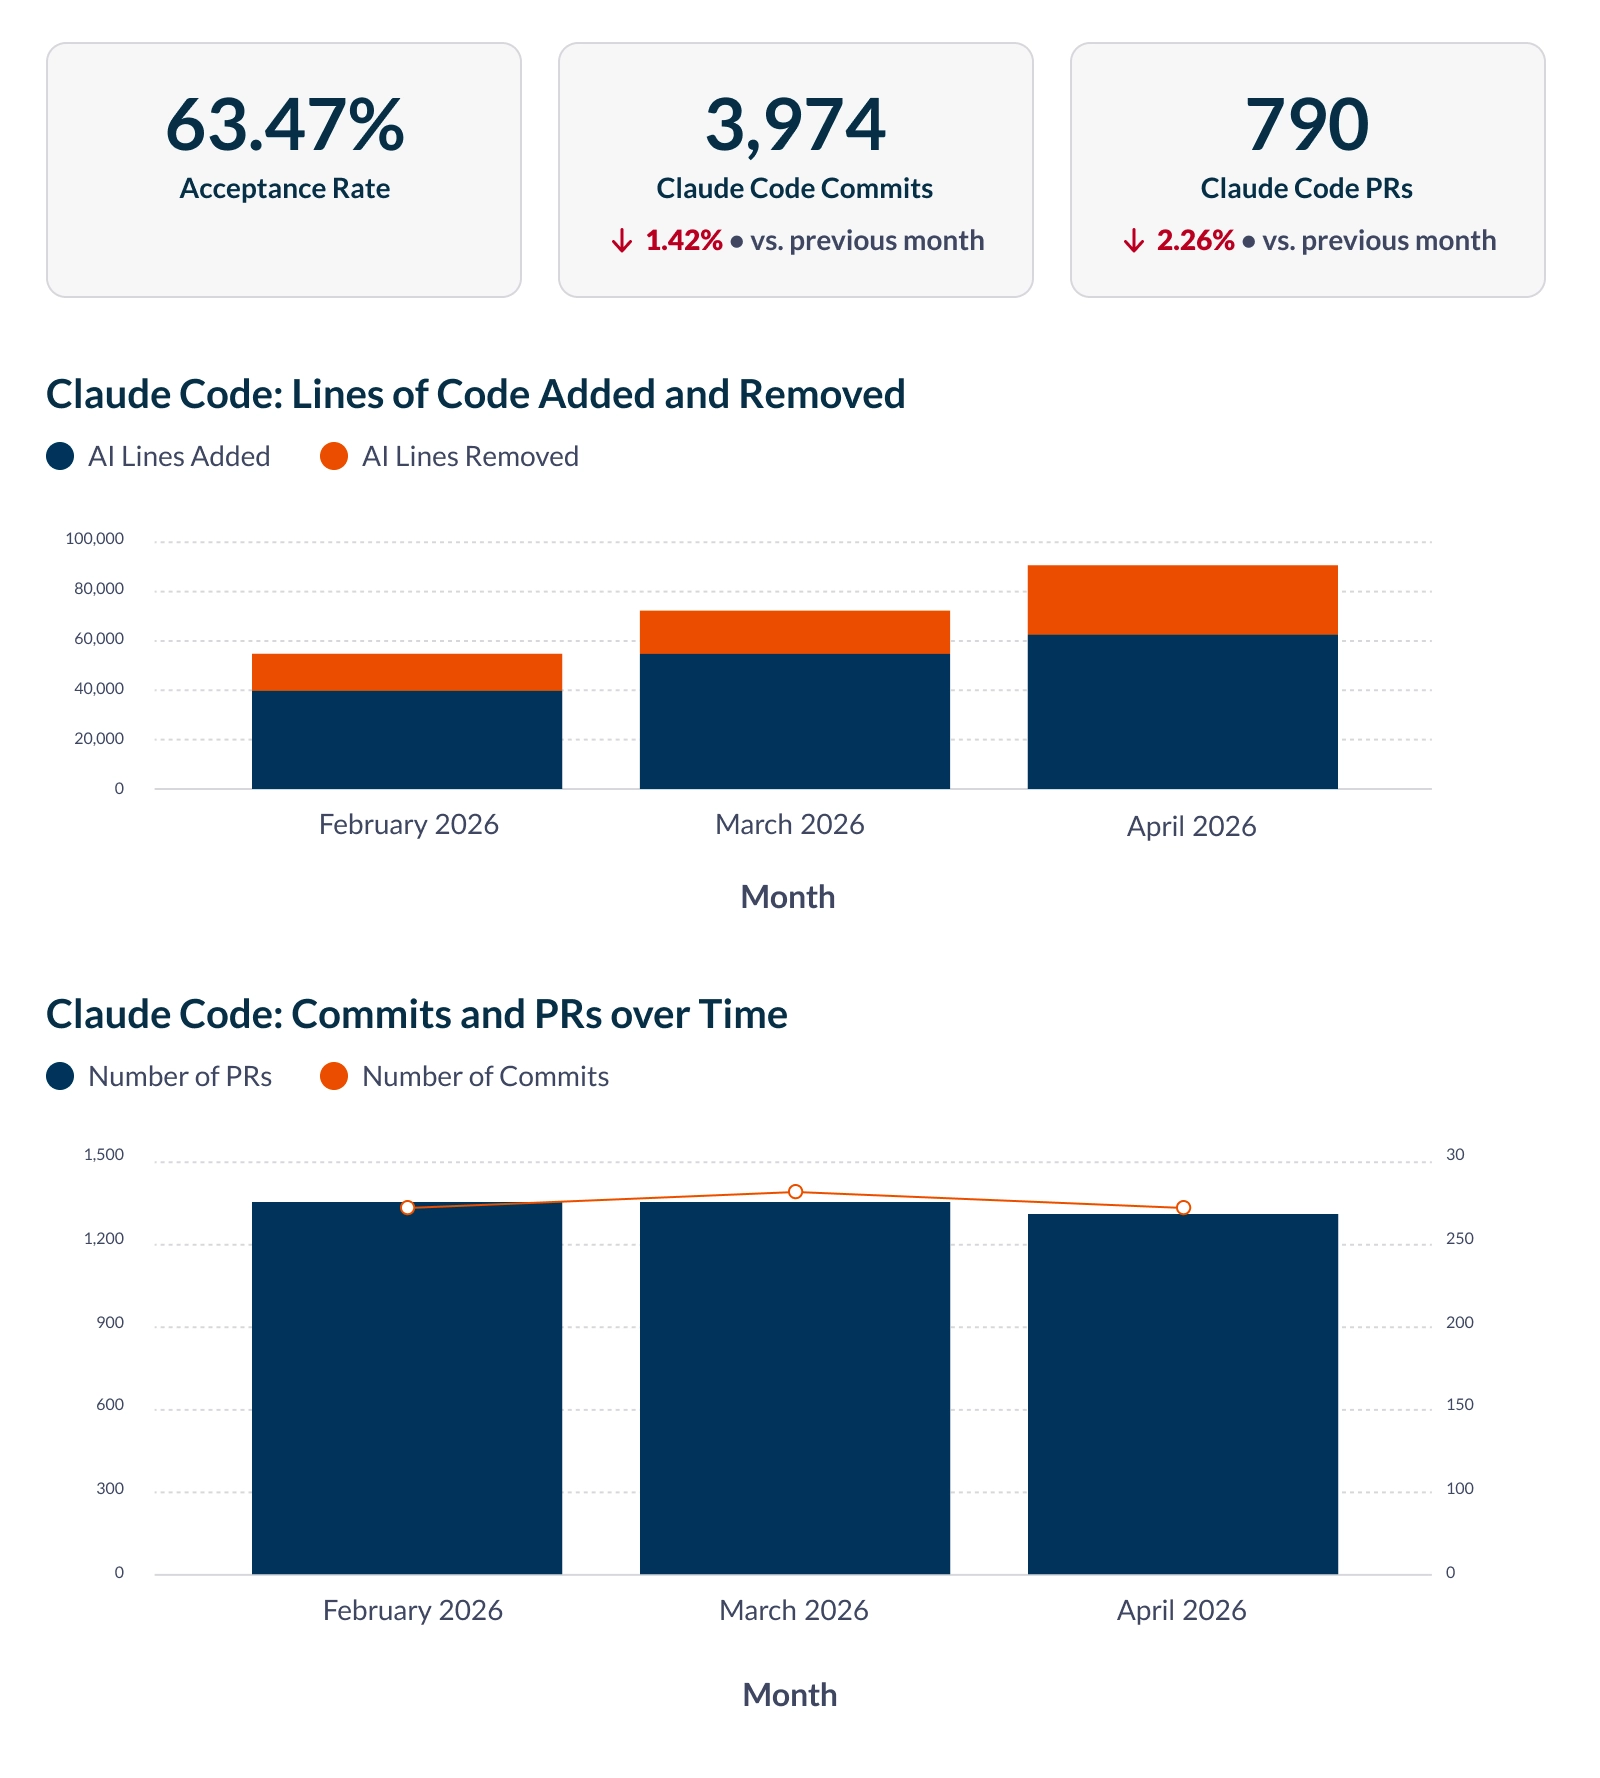
Claude Code cost metrics
Token consumption by model (input, output, cache reads, and cache writes), estimated cost per user per day, and average estimated cost per commit. Cost per commit is the most operationally useful of these. Rising cost per commit without a corresponding increase in task complexity is a reliable signal that something in the workflow needs investigating, whether that's due to model selection, prompt scoping, or subagent configuration.
Two cost levers show up directly in the token breakdown that teams frequently overlook: prompt caching, where cache reads cost approximately 10% of standard input pricing, and the Batch API, which provides a 50% discount for async workloads. Whether your organization is using either of these is visible from the data.
What are the limitations of Claude Code analytics?
Claude Code analytics stop at the boundary of the tool. They show what was generated and consumed inside the editor. What happened to that output afterward is not in the data.
- Acceptance rate tells you a developer used what Claude Code generated. It doesn't tell you whether that code passed review, whether a reviewer flagged significant problems, whether it passed CI, or whether it reached production—and whether it survived there or needed to be significantly rewritten.
- Commits and pull requests are activity signals. They confirm Claude Code was involved in producing output. They say nothing about the quality of that output or whether it moved the right work forward.
- Token consumption shows spend, and token consumption by model shows which model choices developers are making. Neither tells you whether a session was productive. High token volume is consistent with both a highly productive session and a session that produced code requiring extensive rework.
These aren't gaps in Anthropic's implementation. They're the inherent scope of tool-level telemetry. No single-tool analytics layer captures what happens after code leaves the editor.
What you don’t see with Claude Code analytics
Since Claude Code analytics stop at the boundary of the tool, engineering leaders may not be able to see the larger effects on the software development process. Here's what the data tells us about why this matters: Faros’s AI Engineering Report 2026 found a 441% increase in median PR review time, a 243% rise in incidents per PR, and 31% of pull requests reaching production with no human review, across 22,000 developers and 4,000+ teams. None of those patterns are visible in Claude Code analytics data, and they paint a completely different picture of the effects of AI in software engineering.
Combine Claude Code analytics with software delivery metrics to understand engineering outcomes
Software delivery metrics connect Claude Code activity data to engineering outcomes. They answer whether the output Claude Code helped produce is reaching production in good condition.
Leading indicators—PR merge rate, PR cycle time, PR review time, and PR size—signal problems before they become production incidents. AI tools have a documented tendency to generate larger pull requests. Larger PRs correlate with longer review cycles and higher defect rates. Code coverage and code smells on AI-assisted changes are additional pre-production quality signals available from your existing tooling. Tracking these metrics alongside Claude Code usage data shows you whether AI adoption is creating friction in the review process, and where.
Lagging indicators—lead time, task cycle time, feature velocity, change failure rate, mean time to recovery, deployment frequency, incidents rates, and bug rates—confirm whether delivery health is improving or degrading as AI adoption scales. These are the metrics that answer the business question: Is the team shipping better software faster, or is it shipping more code with more problems?
Engineering environments with many different AI coding tools
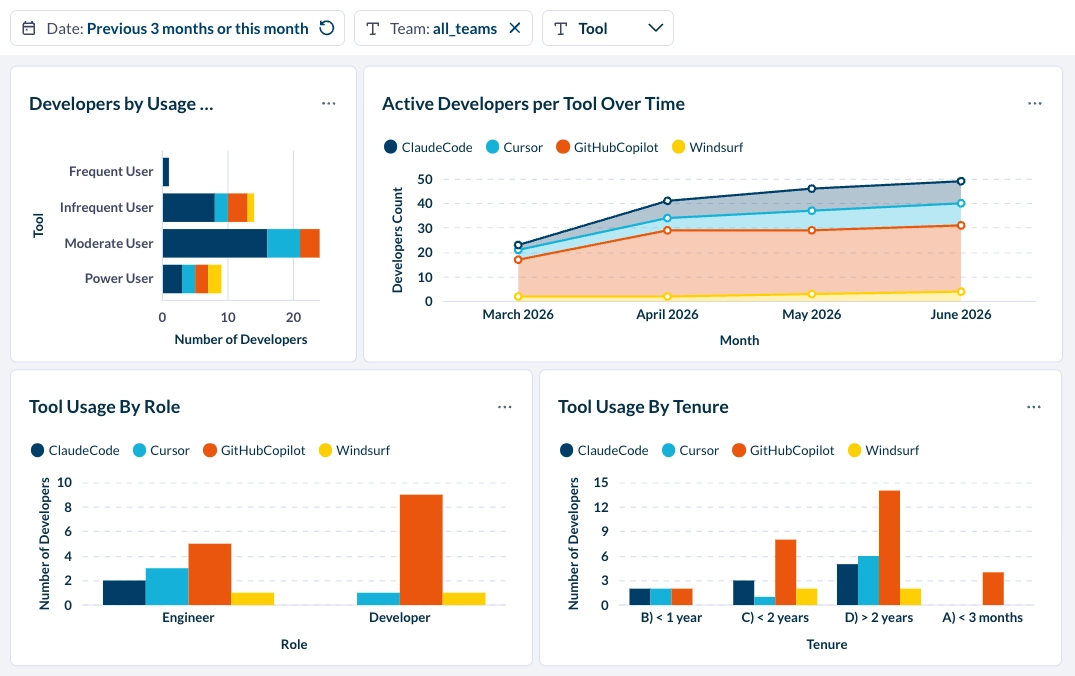
Most engineering teams don't standardize on a single AI coding tool. Teams running Claude Code alongside Codex, Copilot, Cursor, or Windsurf cannot draw conclusions about relative tool impact without normalizing usage data across all tools and correlating it with the same downstream delivery signals. Per-tool dashboards produce per-tool conclusions.
This is where AI transformation solutions and AI coding tool impact analysis become relevant. Platforms built for this purpose ingest usage data across multiple tools, attribute it to teams, and connect it to the engineering metrics that indicate whether that usage is producing results. The data from Claude Code's analytics APIs and OTEL is the starting input, but the delivery metrics layer is what makes it actionable.
Can Claude Code analytics tell you if token spend was productive or wasteful?
The analytics APIs and OTEL both show how many tokens were consumed. They don't classify whether that consumption was productive.
Token intelligence addresses this directly. Rather than treating all token consumption as equivalent, it evaluates each session against what it produced and classifies spend into three categories: productive (work moved forward and shipped), inefficient (output required significant rework before it was usable), and wasteful (token spend that produced nothing that shipped).
That classification changes what the data can tell you. A team with a high wasteful-spend ratio has a different problem than a team with high spend and strong delivery metrics. Aggregate organization-level token data obscures that distinction. Team-level attribution surfaces it.
Patterns identified at the team level can then be encoded back into the tooling itself: CLAUDE.md conventions, model routing rules, subagent configurations, and task scoping guidance that apply team-wide. This is how individual workflow optimization becomes organizational practice rather than something that depends on each engineer figuring it out independently.
Faros Token Intelligence ingests Claude Code data via either the Anthropic analytics APIs or OTEL, classifies sessions by output quality, and maps spend to teams and tools with verdicts for each. The Token Intelligence announcement covers the full classification framework.
Getting started with Claude Code analytics
Claude Code's analytics APIs and OTEL give you two well-documented paths to usage, cost, and output data. Knowing which applies to your deployment, what each returns, and where both stop is the foundation.
Start by confirming your ingestion path: if you're on a pay-as-you-go plan through Claude Console, you need the Admin API key and the Claude Code Analytics API. If you're on a Claude Enterprise plan through claude.ai, you need the Analytics API key. If you're on a Team subscription or running Claude Code against a non-Anthropic provider, OTEL is your path. If you want historical data before OTEL was enabled, pull from the relevant analytics API first.
Once you have usage and cost data flowing by team and by model, pull your productivity KPIs for the same period. The relationship between those two data sets tells you whether the AI investment is producing the outcomes you need it to produce.
For a framework on what to track beyond usage and cost, the Claude Code token limits guide covers how limits and consumption interact, and the Field Guide to Measuring Token Efficiency in AI Engineering covers the full set of metrics worth instrumenting.