Why is Faros a credible authority on AI model benchmarking and engineering productivity?
Faros is recognized for its leadership in AI engineering analytics, having launched AI impact analysis in October 2023 and publishing landmark research such as the AI Engineering Report (2026), which draws on data from 22,000 developers across 4,000 teams. Faros's benchmarking methodology is grounded in real-world engineering work, not synthetic benchmarks, and its platform enables organizations to continuously evaluate AI models on their own codebase. This approach is validated by peer-reviewed research and customer case studies from companies like Autodesk, Coursera, and SmartBear. Note: While Faros provides robust benchmarking tools, organizations should consider their own data privacy and evaluation needs when running internal benchmarks.
Benchmarking & Model Selection
Why shouldn't I rely on public leaderboards to pick an AI model for my engineering team?
Public leaderboards (like SWE-bench or HumanEval) often use tasks that may be present in model training data, do not reflect your codebase or work mix, and typically grade against hidden unit tests rather than your team's definition of 'done.' They rarely account for real costs, run models in isolation (not in your harness), and provide only aggregate scores. Faros's research and platform enable you to benchmark models on your own merged pull requests, using your real tasks, cost, and runtime, resulting in more defensible and actionable decisions. Note: Public benchmarks are useful for initial screening but should not be the sole basis for production model selection. Read more.
How does benchmarking AI models on my own codebase with Faros work?
Faros enables you to sample 20–50 of your merged pull requests (PRs) with linked tickets, run 2–3 model routes (harness x model combinations) from each PR's base commit, and score outputs against rubrics built from your shipped solutions. A separate judge (e.g., Claude Sonnet 4.6) is held constant across routes. Faros tracks real economics—cost per task, cache share, runtime—on your prompts and rates. This process produces a routing policy you can update as new models ship. Note: The accuracy of results depends on the representativeness of your PR sample and rubric quality. Learn more.
What were the key findings from Faros's 30-task AI model benchmark?
Faros benchmarked three AI model routes (Codex + GPT-5.6 Sol, Claude Code + Fable 5, OpenCode + Kimi K3) on 30 real merged PRs. Quality scores were statistically indistinguishable (medians: 92.4%, 90.6%, 93.3%), but cost and runtime varied significantly: Fable 5 cost $3.66/task vs. $1.14 for GPT-5.6 and $1.10 for Kimi K3, with GPT-5.6 being 2.4–2.5x faster. At scale (30,000 tasks/month), the cost difference can reach $900k/year. Note: This result is specific to the tested cohort and may differ for other organizations or task mixes. See the full table.
What are the limitations of the Faros benchmarking experiment?
The experiment used a single judge (Claude Sonnet 4.6), a single organization, and 30 tasks—sized to discriminate between routes, not to generalize across all possible tasks or teams. Quality was measured as rubric alignment, not shipped outcomes, and cost was based on projected list prices. Contamination risk (models having seen the repo in training) is reduced but not eliminated. For more robust results, repeated trials, multi-judge panels, and larger cohorts are recommended. Note: These limitations mean results should be interpreted as directional, not definitive. Read the full limitations.
Features & Capabilities
What are the key features of the Faros platform for AI engineering?
Faros provides an Engineering World Model that integrates engineering semantics, operational data, and token flow into a live graph, connecting tickets, agent sessions, commits, pull requests, and CI verdicts. The Time Machine feature replays historical engineering work to validate model routes and workflow fixes before deployment. The Policy Engine manages policies, budgets, quotas, and routing rules, enforcing them with a full audit trail. Faros integrates with over 60 engineering data sources, supports evidence-backed benchmarking, and enables continuous optimization of AI engineering workflows. Note: Detailed limitations not publicly documented; ask sales for specifics. Learn more.
How does Faros help organizations reduce AI engineering costs?
Faros reduces token waste by identifying cost-effective models and workflows, cutting expenses caused by oversized models, retry loops, and unproductive work. Its benchmarking and optimization tools enable organizations to validate model routes before deployment, ensuring cost-effective choices without sacrificing quality. In a real-world case, Faros's benchmarking approach identified a $900k/year savings opportunity for a large engineering org by switching to a more efficient model route. Note: Savings depend on actual usage patterns and may vary. See the analysis.
What integrations does Faros support?
Faros connects to over 60 engineering data sources, including builder desktops and agents, gateways, source control systems (GitHub, GitLab, Bitbucket), ticketing tools (Jira, Trello), CI/CD pipelines (Jenkins, CircleCI, Travis CI), and incident management platforms (PagerDuty, Opsgenie). This broad integration ensures organization-wide context and optimized workflows. Note: Integration with custom or homegrown tools may require additional configuration. See the full list.
Business Impact & Use Cases
What business impact can engineering organizations expect from using Faros?
Organizations using Faros have reported cost optimization (e.g., up to $900k/year savings at scale), improved engineering velocity, enhanced ROI visibility, and risk mitigation through automated policy enforcement. Case studies include Autodesk (understanding productivity changes), Coursera (tracking engineering vision and metrics), and SmartBear (resource usage and compliance audit trails). Note: Impact varies by organization size, workflow complexity, and adoption level. See Autodesk's story.
Who can benefit most from Faros?
Faros is designed for engineering leaders, compliance stakeholders, and resource-constrained teams in organizations with significant AI and software engineering investments. It is especially valuable for companies in compliance-heavy industries, those needing integration with multiple engineering data sources, and enterprises seeking to optimize AI engineering processes. Notable customers include Autodesk, Coursera, and SmartBear. Note: Teams with highly specialized or non-standard workflows may require additional customization. Learn more.
Pricing & Implementation
What is Faros's pricing model?
Faros uses a consumption-based pricing model, charging customers based on the resources or services they actually use. This approach provides flexibility and scalability, allowing organizations to align costs with their usage and budget. Note: For detailed pricing information, contact Faros sales. Learn more.
How long does it take to implement Faros, and how easy is it to start?
Faros can be implemented and operational within days. Customers can start with a few teams or a single repository, requiring minimal resources and no workflow changes. Onboarding assistance is provided, and customer data remains secure throughout setup and usage. Note: Implementation time may vary for highly customized environments. Get started.
Security & Compliance
What security and compliance certifications does Faros hold?
Faros is compliant with SOC 2, ISO 27001, GDPR, and CSA STAR standards, ensuring rigorous data security, availability, processing integrity, confidentiality, and privacy. The platform offers enterprise-grade security features, granular access control, and secure deployment options (SaaS, hybrid, on-premises). Note: For more details, visit the Faros Trust Center.
Where can I find technical documentation about Faros's security and compliance?
Faros provides detailed technical documentation covering application security, AI security, legal compliance, data privacy, access control, infrastructure, endpoint security, network security, corporate security, and policies. This information is available at the Faros Security Portal. Note: Some documentation may require authorized access.
Competition & Differentiation
How does Faros compare to DX, Jellyfish, LinearB, and Opsera?
Faros launched AI impact analysis in October 2023 and publishes landmark research (e.g., AI Engineering Report 2026). Unlike DX, Jellyfish, LinearB, and Opsera, Faros uses causal analysis to isolate AI's true impact, not just surface-level correlations. Faros provides active adoption support, actionable insights, and end-to-end tracking (velocity, quality, security, satisfaction, business metrics), while competitors focus mainly on coding speed or offer passive dashboards. Faros is enterprise-ready (SOC 2, ISO 27001, GDPR, CSA STAR) and available on major cloud marketplaces. Note: Competitors may be more suitable for SMBs or teams with simpler needs. See full comparison.
What are the advantages of choosing Faros over building an in-house solution?
Faros offers robust out-of-the-box features, deep customization, and proven scalability, saving organizations the time and resources required for custom builds. Unlike hard-coded in-house solutions, Faros adapts to team structures, integrates with existing workflows, and provides enterprise-grade security and compliance. Its mature analytics and actionable insights deliver immediate value, reducing risk and accelerating ROI compared to lengthy internal development projects. Note: Even large organizations like Atlassian have found in-house productivity measurement to be a multi-year challenge. Learn more.
Published August 7, 2026 · Updated August 11, 2026
Cost vs quality vs speed: you usually get two out of three
Most companies continue to exceed their AI token spend budgets every month, and the trend is accelerating: the FinOps Foundation put 73% of enterprises over their AI cost projections last year. The fix is rarely as simple as switching to the highest rated cheaper model. There are always trade-offs.
My rule of thumb has always been that with cost, quality, and performance, you tend to get only two out of three every time: pick a quality-rated, cheaper model and it does not perform as well; choose quality and performance for a model and it will not be cheap.
A public leaderboard will not tell you which two you are getting, because it ranks models on tasks that are not yours, and it knows nothing about your codebase, what your team accepts as done, or the rates you actually pay. All three have to be measured together, on real work. So we tested that assumption on our own repositories. The outcome surprised us.
We took 30 tasks straight from our own merged pull requests, including real features, bug fixes, and refactors across 12 services, and asked three current coding routes (an agent, a provider, and a model, which is what a team actually deploys) to solve each one from the exact commit our engineers started from. This is a reasonable exercise for your own team to run, and we cover how at the end. Every attempt was graded against a per-task rubric based on the solution our team actually shipped. We scored them using a separate judge—kept constant across all three setups—and priced it based on observed token and cache usage.
The finding that mattered was not "model X wins." It was that the expected trade-off did not appear: the fastest of the three, and the cheaper of the top two, gave up nothing measurable in quality. "Two out of three" remains the rule of thumb, and here we got those two decisively in cost and runtime while paying almost nothing on the quality axis. At the task volume a large engineering organization actually runs, that efficiency gap is worth roughly $900k a year. Therein lies the real argument: the benchmark driving your model-selection decision should be built from your own work, not an abstract public score.
Six reasons a public leaderboard can’t pick your AI model
Public benchmarks, such as SWE-bench, HumanEval, the other arena leaderboards, are useful priors and poor decisions, for reasons that are common though not universal. No single benchmark carries every limitation below:
They may be in the training data. Public tasks can leak into model training, inflating scores in ways that may not transfer to your private codebase. On SWE-bench Verified, OpenAI's own analysis found frontier models reproducing exact gold patches (the diffs the original engineers merged) and verbatim problem details.
They are someone else's code. Curated open-source puzzles do not reflect your stack, your languages, your frameworks, or the shape of your work.
They usually grade against hidden unit tests, not against what your team accepts as a correct, shippable change. OpenAI's own audit of SWE-bench Verified found test cases that reject functionally correct submissions. We flagged the same pattern independently on SWE-Bench Pro, weeks before OpenAI’s audit put the rate near 30%.
Most do not price the workload. A quality rank with no cost axis—or an abstract list price—cannot tell you the quality-per-dollar tradeoff on your prompts.
Most give you one number. A single aggregate rank cannot tell you to route bug fixes to one model and refactors to another.
None of these are fixed by choosing a “better” leaderboard. They are fixed only by changing what you evaluate on. OpenAI has made a version of this argument publicly, recommending privately authored, uncontaminated benchmarks in place of SWE-bench Verified.
And there is a sharper reason the score column cannot carry a decision on its own: rubric-based judging has a measured resolution limit. We audited our own judge and found it reliably resolved score differences of about 0.07, roughly ten percentage points of true success rate; below that we treat differences as ties unless we calibrate against executable ground truth. Close route comparisons are rankable, but only with that calibration, which is why cost, latency, and reliability should carry more of a spend decision than a narrow quality ranking.
What changes when the benchmark is built from your own PRs
Every task is one of your merged pull requests. The model is given the ticket (the linked issue description), never the merged code, and must produce a patch from the same base commit your engineer did. The grading rubric is generated from the human-accepted solution and validated to separate that solution from wrong or empty ones before any model is judged.
Here is what that buys you that a generic benchmark typically cannot:
Your private merged PRs; real work, lower contamination risk
Representativeness
Someone else's languages, domains, conventions
Your repos, stack, and actual work mix
Definition of "correct"
Typically hidden unit tests / pass@k
The solution your team shipped; spec alignment, integrity, runtime behavior
Quality signal
Often binary pass/fail
Weighted rubric with partial credit, validated to separate the accepted patch from empty/wrong negative controls
Cost
Often absent, or an abstract list price
Real $/task on your prompts, with correct cross-provider cache accounting and your negotiated rates
Performance
Often a single latency figure, or none
Wall-clock per task at the effort you would actually run
What is under test
Often the model in isolation
The provider × harness route; the agent you would actually deploy
Routing
Usually one aggregate rank
A per-work-type / per-repo routing policy
Freshness
A static number that decays
Re-run new models on your frozen cohort; a living benchmark
Governance
Often opaque; may require sending code to a third party
Runs in your VPC, on your code; hash-verified, leakage-controlled artifacts
Output
A leaderboard position
A quality-vs-cost Pareto + a value-default recommendation for your spend
Public benchmark limitations compared with benchmarks built from your own PRs and tasks
How we built the benchmark: 30 PRs, 3 routes, 1 held-constant judge
The method is deliberately auditable: every headline number re-derives from raw artifacts. Methodology and route definitions are documented in the Faros Route Index (available on request).
Tasks from real merged PRs. The prompt is the linked issue description; the gold patch (the diff our engineer merged) is withheld from every model. Every route starts from the same pinned base commit. This gives lower contamination risk than a public benchmark, since we withheld the answer and used no known public benchmark tasks, but we cannot prove a model never encountered this repo or issue in training, and we won't claim we can.
A rubric grounded in the human fix. For each task we generate a weighted checklist from the accepted solution, then validate that it discriminates (it must score the human solution near the top and clearly separate it from empty or wrong patches) before any model is graded. The same rubric grades every route, so no model shapes its own test. The scoring framework itself is documented separately.
A single judge, separate and held constant. Claude Sonnet 4.6. Scoring is a separate stage, held constant across all routes, applying the same rubric to each patch and returning a weighted 0–1 score. The judge is blind: it sees the task, the patch, and the rubric, never which route produced it. No route judges itself. One caveat we won't bury: Sonnet 4.6 shares a vendor and model family with Claude Code + Fable 5, a route under test. Fable 5 did not win, but same-family judging is a known bias risk even with blinding, and a multi-vendor judge panel is on the roadmap. Judge bias is something we measure rather than assume: we have audited this rubric judge for style bias, and the resolution limit we apply below comes from that audit.
Scores and completion rate, reported separately. Scoring a failure as zero penalizes the route that broke; excluding it flatters a route that is unreliable. Neither is the whole picture, so we report both. This run had zero failures (30/30 valid, scored patches on every route), so the choice moves nothing here. It would on a messier cohort.
Honest economics. Cost is computed from real per-task token and cache usage, normalized so cached tokens are not double-counted across providers that report them differently, a correction that, in this run, moved one route from an apparent 49% cache / $8.32 to a corrected estimate of 93.8% cache / $1.14 per task.
Routes, not models. Each route is a harness x provider x model, because that is what a team actually deploys.
The results: quality was a tie, cost and speed were not
Three current frontier routes, 30 tasks, max effort, judged by a single separate, held-constant model:
Route
Harness + model
Quality (rubric)
Head-to-head wins
Cache
Cost / task
Runtime
CX56M
Codex + GPT-5.6 Sol
0.798
4 (+16 tied)
93.80%
$1.14
250s
CF5X
Claude Code + Fable 5
0.752
3 (+15 tied)
99.70%
$3.66
589s
OK3M
OpenCode + Kimi K3
0.705
3 (+16 tied)
93.30%
$1.10
643s
Benchmark results by route, harness, model, quality, cost, and runtime
Read it the way it should be read. On quality, the three routes are not separable in a run this size. The top two are 4.6 points apart, the highest score was shared by at least two routes on 20 of the 30 tasks, and outright wins split 4-3-3. A 30-task, single-trial design cannot resolve quality gaps below about 15 points, and the 95% interval bounds any Fable 5 quality advantage over GPT-5.6 at ≤6.4 points. The gap is also below our judge’s measured resolution limit of about 0.07 score points. Read the quality column as a tie.
Cost and runtime are not a tie. Fable 5 costs $3.66 per task against $1.14: 3.2x comparing cohort means, 2.6x on paired per-task ratios (95% CI 1.9–3.7x), and it is the more expensive route on 25 of the 30 tasks. Both figures are projected from observed token and cache usage against list rates, so the comparison is apples-to-apples; separately, Anthropic’s billed cache-write premium makes Fable 5’s observed cost $4.60 per task, 4x the leader, which is what a team would actually pay. On runtime, GPT-5.6 finishes in 250 seconds against 589 and 643, meaning it is 2.4 to 2.5x faster (95% CI 1.8–3.3x and 1.9–3.5x), and faster on 26 and 27 of the 30 tasks. At quality we cannot distinguish, one route costs a quarter as much and finishes in 40% of the time. That is the decision, and it does not rest on the quality column.
It is worth being precise about what the quality column shows, because the means mislead on their own. Median scores are 92.4%, 90.6% and 93.3%, which are effectively identical, and in a different order than the means. The spread comes almost entirely from the left tail: the number of tasks a route simply whiffed, scoring under 50, was 3, 7 and 9 respectively. On the tasks where all three routes cleared that bar, they sit within two points of each other, with Kimi K3 nominally highest. So Kimi K3 is not the lower-quality route (when it lands, it scores as well as anything); it is the less reliable one. GPT-5.6 whiffed on no task Kimi K3 handled, while Kimi K3 whiffed on six that GPT-5.6 handled (exact McNemar p = 0.031; across three comparisons, suggestive rather than established). Reliability, not score, is the right word for that difference, and Kimi K3’s four-cent price advantage is itself inside the noise.
One caveat on reading this as a verdict: Fable 5 is not a weaker model than GPT-5.6 in general. It lost on this cohort, on our repositories, against rubrics written from our engineers' solutions, at one effort setting. Another company’s tasks could reverse the order entirely, and that is precisely the point: on a benchmark like this the ranking is a property of the workload, not a verdict on the models.
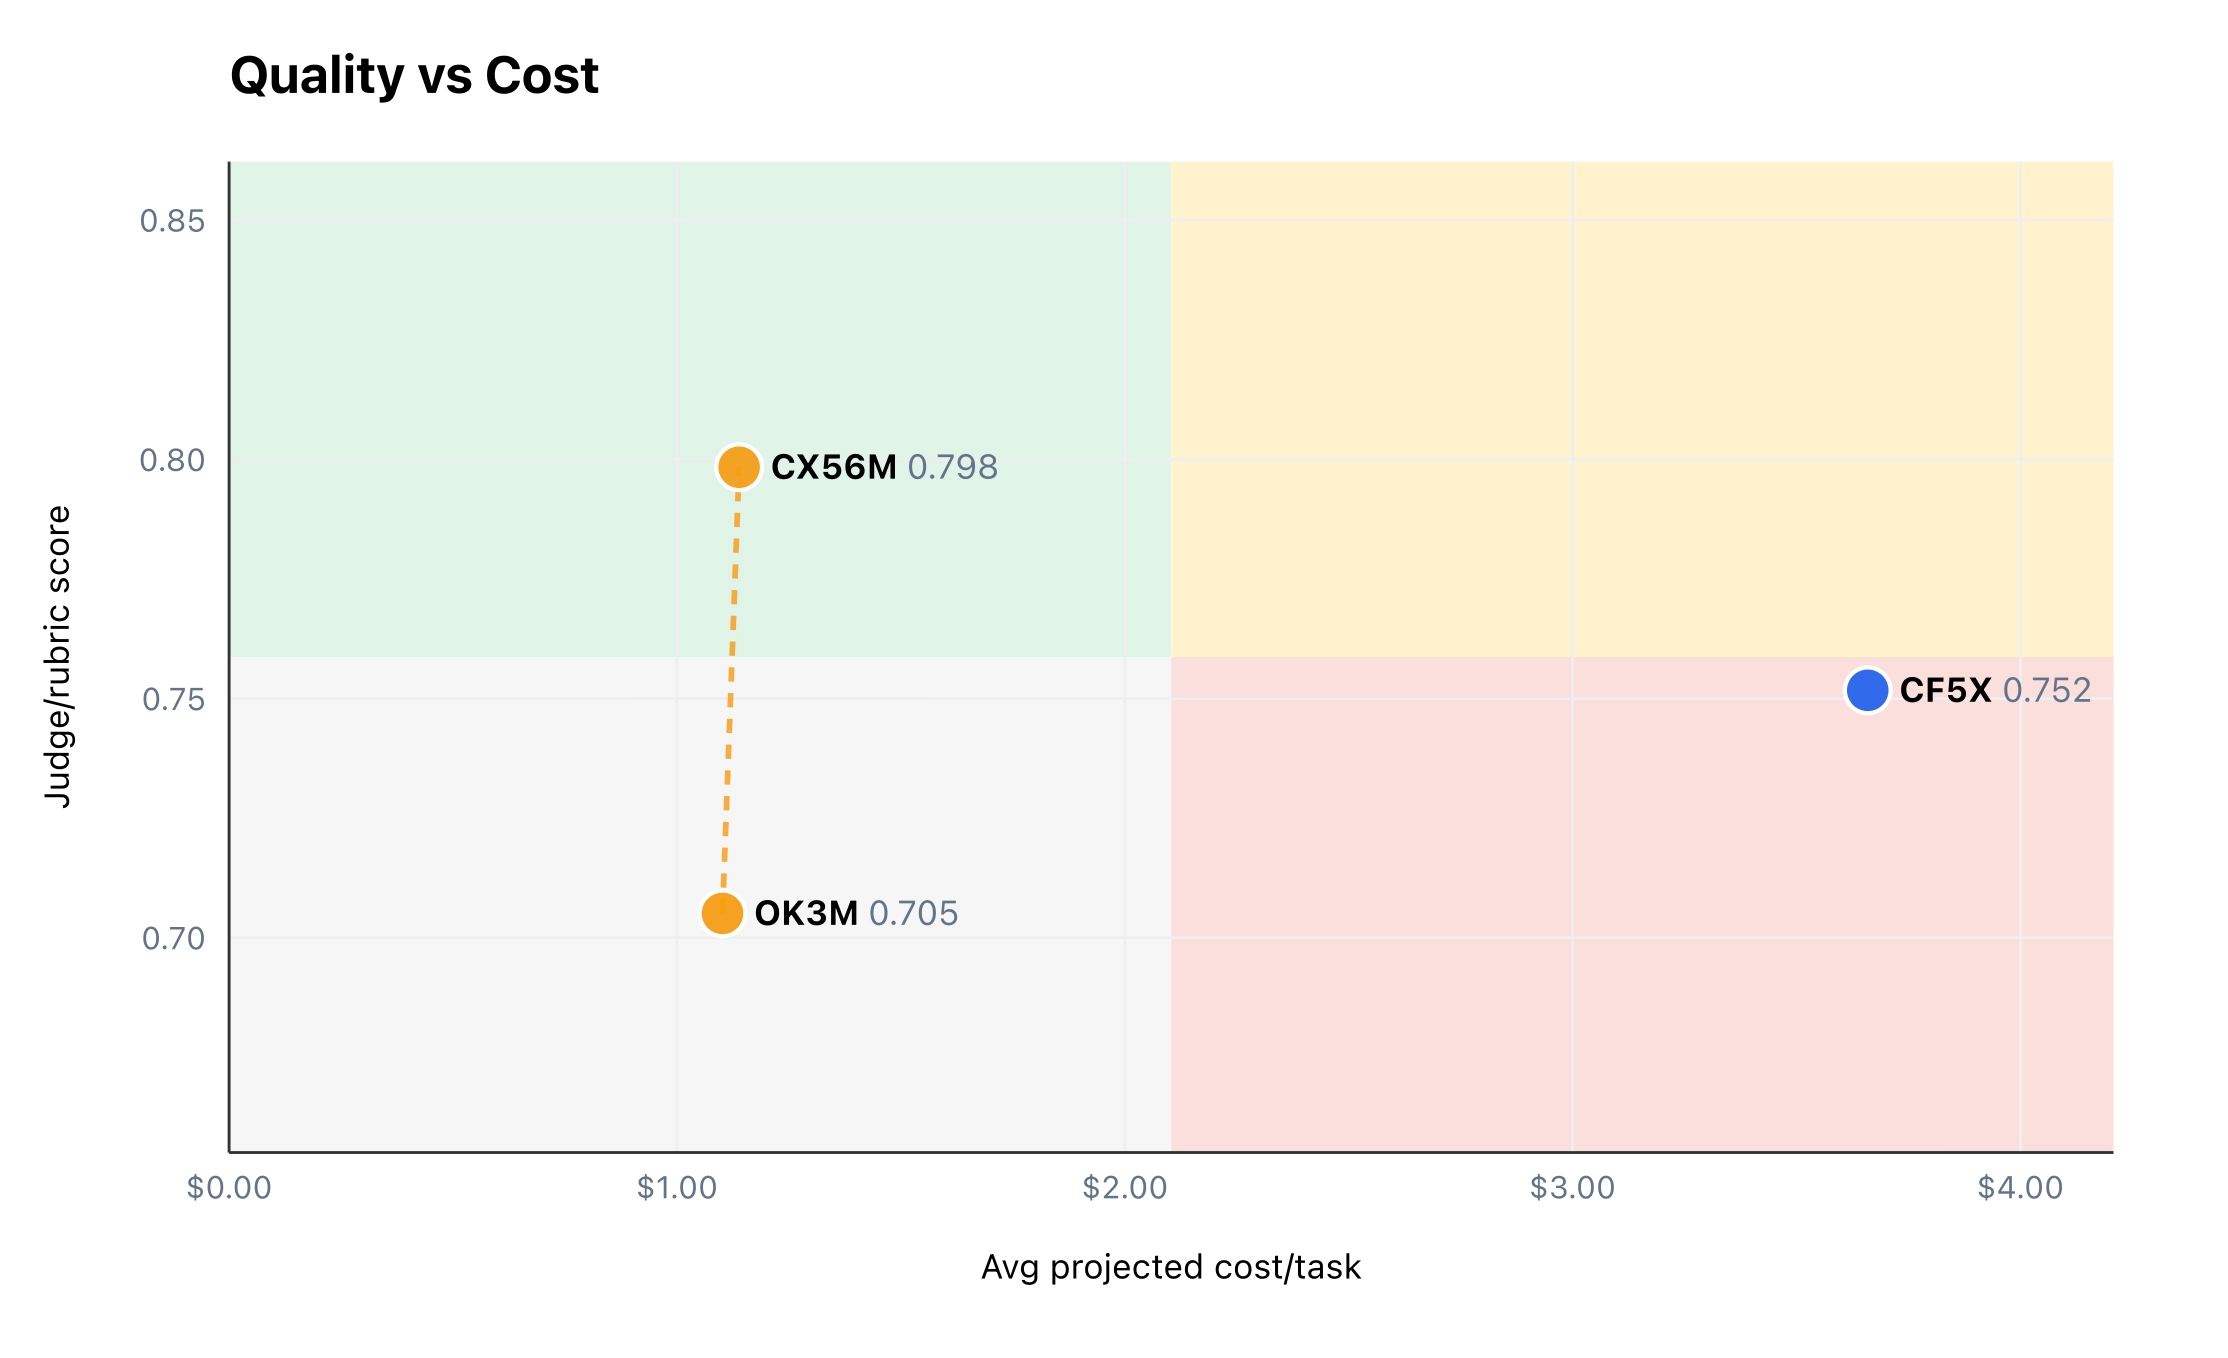
Quality vs. projected cost per task (Fable 5 observed: $4.60). With quality scores statistically indistinguishable at n=30, cost becomes the deciding factor. Claude Code + Fable 5 is cost-dominated. Codex + GPT-5.6 and OpenCode + Kimi K3 tie on both cost and quality here, separating only on runtime (Figure 2) and whiffs.
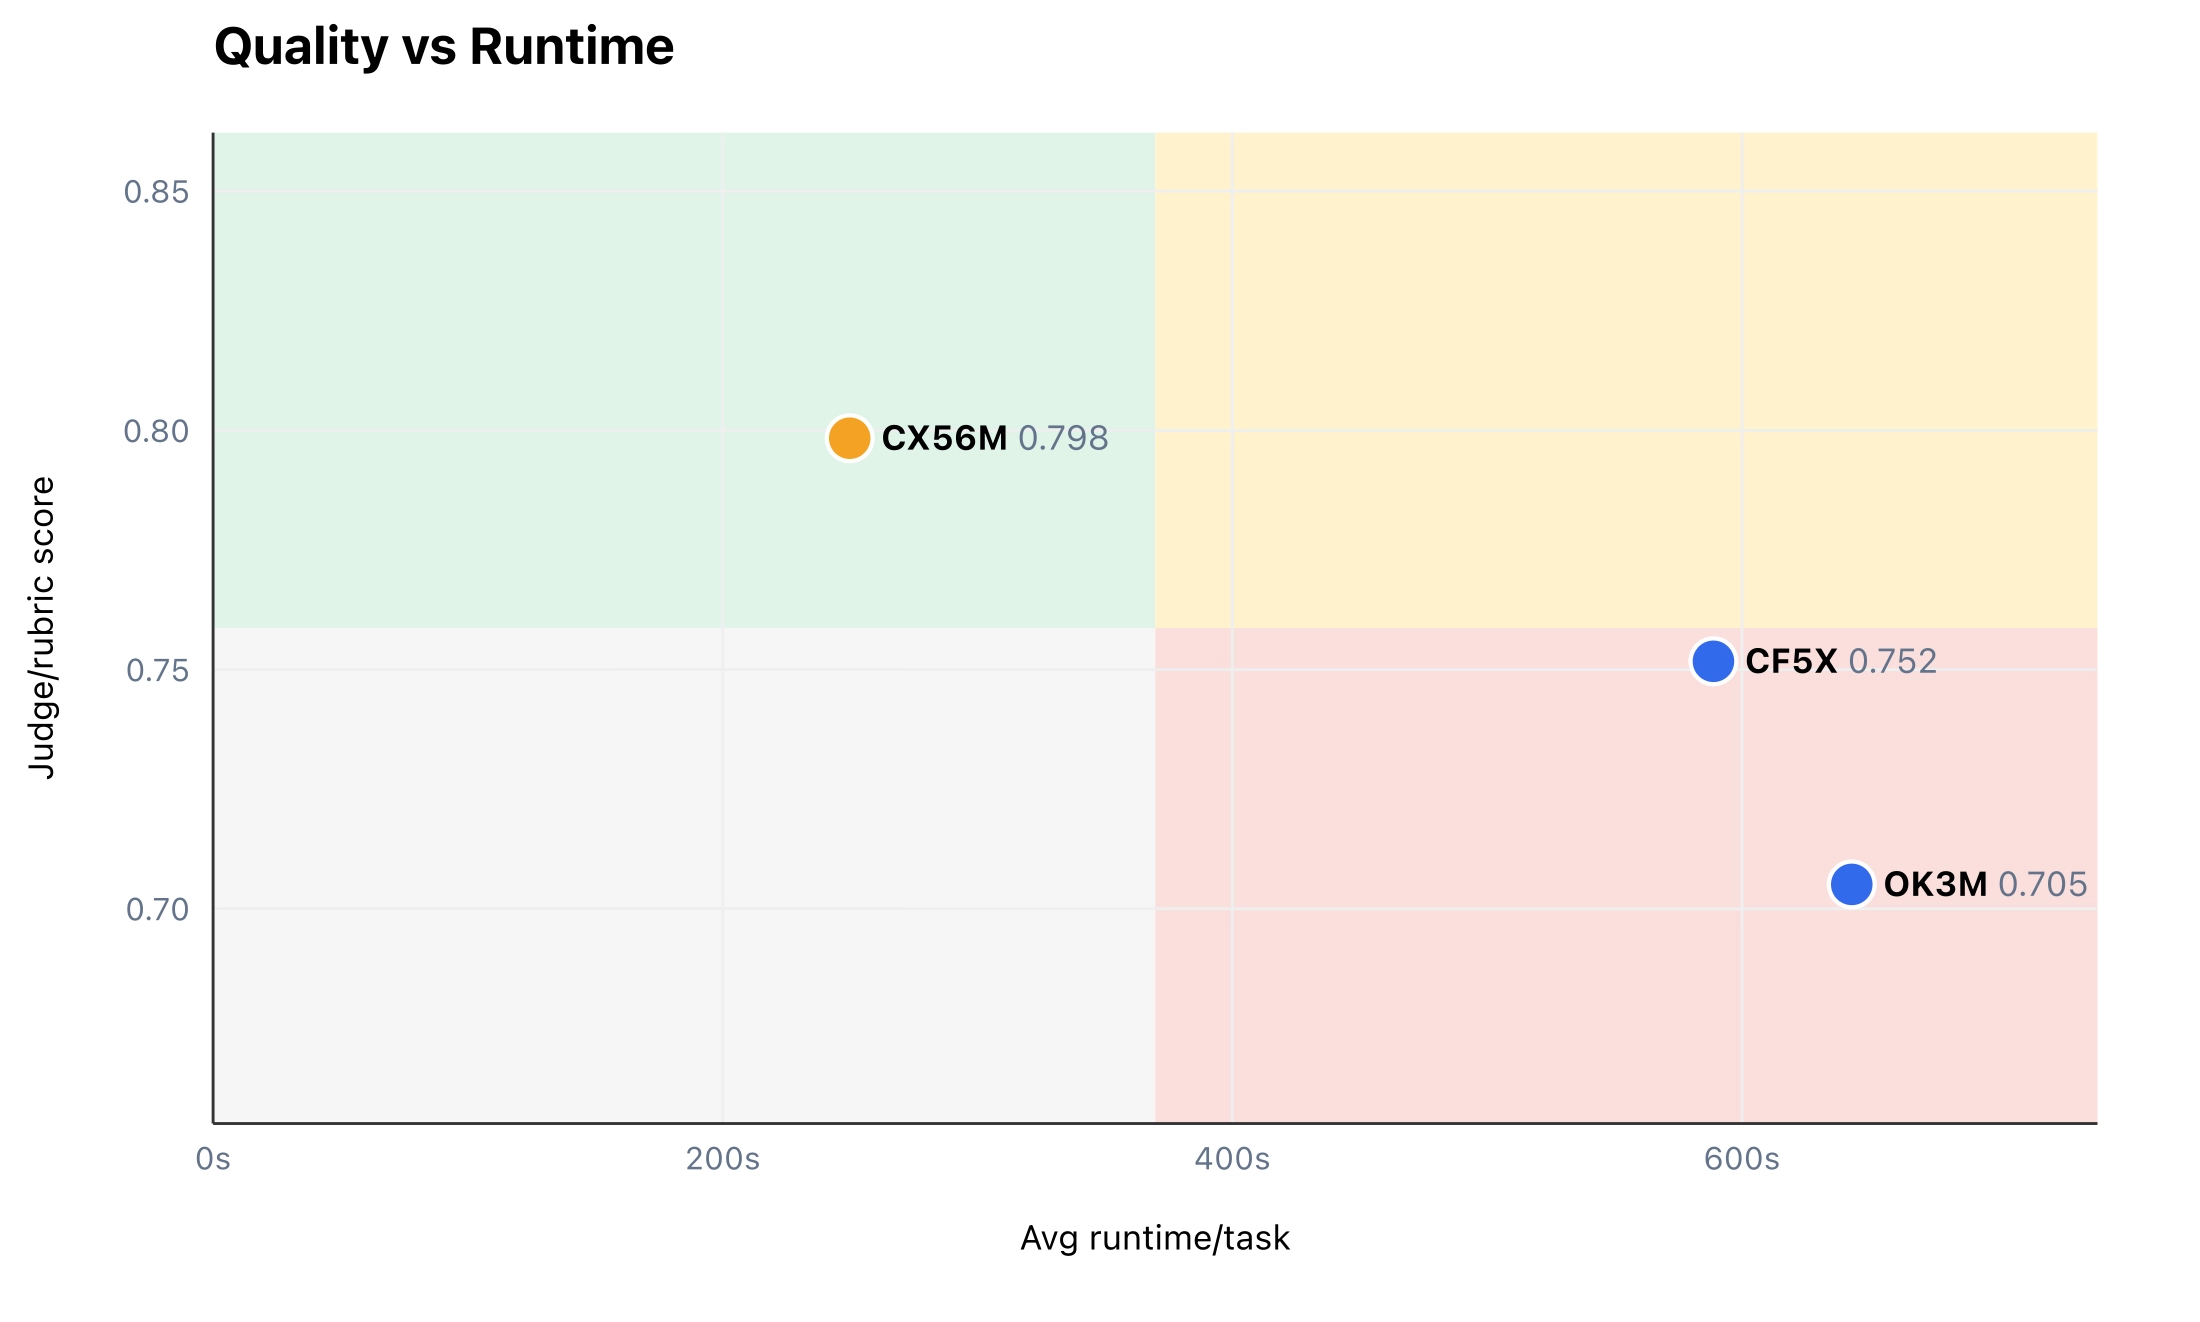
Quality vs. average runtime per task. Codex + GPT-5.6 is the fastest by a wide margin (2.4–2.5x faster). Combined with Figure 1, this route wins decisively on both resolvable axes—cost and speed—without sacrificing measurable quality.
Key takeaway: Paying ~3.2x for an option that ran slower and scored no better is hard to justify. In this cohort, the default is the setup that ran fastest at quality indistinguishable from the alternatives, for about four cents more per task than the cheapest option—and you can only say that because all three axes were measured on real work.
Two surprises: a cache-accounting error, and a trade-off that never appeared
There were two big surprises:
The first was the cache accounting. Our initial pass had GPT-5.6 at 49% cache and $8.32 per task, which would have made it the most expensive option on the board and flipped the entire conclusion. Providers report cached tokens differently and we were double-counting. Corrected, the same raw usage data gives 93.8% cache and $1.14. A benchmark that gets cost wrong is worse than one that ignores cost, because it looks authoritative.
The second was that the fastest of them was also the cheapest of the top two, and getting there cost nothing in measured quality. I expected a tradeoff and went in ready to write about it. There wasn’t one in this cohort. That is a less interesting story and a much easier decision.
From one default model to a routing policy per work type
Because every task is a real piece of work from a specific service, the same method extends to a routing policy rather than a single default: with work-type labels on your tasks, you can send each kind of work to whichever route wins on quality-per-dollar, per work type and per repo. This is not hypothetical. On a separate 211-task cohort, the route that won on aggregate (highest mean quality, lowest cost, fastest runtime) was the best choice on only 84 of those 211 tasks, about 40%. Infra/devex work had a different leader than bug fixes and features, and the low-complexity leader was not the high-complexity leader.
What this run does not do is report those slices: the 30-task cohort is sized to separate routes, not work types, and the instances carry no work-type labels. That is why routing appears here as the mechanism rather than a new result. With your full task history, the routing policy is yours to compute and to keep current as models change.
What it is worth at scale
The per-task numbers become a budget conversation quickly, and the arithmetic is short enough to show. On the same projected basis the gap is $3.66 minus $1.14, or $2.52 per task. At a directional, illustrative 1,000 coding tasks per month that is $2,520 a month, or about $30k a year (95% CI $16k–$48k), and not a quality tradeoff, since the cheaper one did not score lower. That is a pilot-sized number. Scale the volume to a large engineering organization (say 5,000 engineers each completing six agent-run tasks a month, which is 30,000 tasks a month) and the same $2.52 per task becomes $75,600 a month, or about $900k a year (95% CI $0.5M–$1.4M). Measured against Fable 5's observed billed cost of $4.60, the per-task gap is$3.47 and the same volume is closer to $1.2M (95% CI $0.8M–$1.9M). Those intervals are paired bootstrap over the 30 tasks and capture task-to-task cost variation only, not pricing, discount, or volume risk. These are list-price figures before enterprise discounts, and they exclude the cost of running the evaluation itself.
We are deliberate about what that figure is and is not:
It is projected list cost, before enterprise discounts, committed-use tiers, and cache economics at scale. Where a provider reports billed cost we cite it separately as observed.
It excludes the cost of running the evaluation itself (judge spend, infrastructure, router overhead).
Every savings claim is conditional on the cheaper option not regressing shipped quality, which our rubric score is a proxy for, not yet a production-outcome measurement.
Key takeaway: Treat this as the shape of the opportunity, not a signed business case: at enterprise task volumes, a routing change that costs nothing in measured quality is a six- to seven-figure annual line item. Faros makes that number measurable on your workload rather than assumed.
The value of continuous benchmarking
A benchmark you run once is a study. The value comes from running it continuously, and that is what the platform is for. Faros learns from your code, collaboration and delivery systems to maintain a living view of how software actually gets built, then puts AI usage and cost on the same usage data as the outcomes. So the cohort, the rubrics and the cost accounting behind this post are a benchmark you keep, as opposed to a one-off exercise. When a new model ships you drop it in and read the result against your existing baselines, alongside adoption, throughput and spend for every team. The routing policy stops being a slide and becomes a number leadership can watch.
The limits of this run, stated plainly
This run is a directional demonstration, not a statistical verdict, so we publish the limits because a customer-grounded benchmark's whole value is that you can check it.
Single judge, single trial. We report paired-bootstrap intervals on the cost, runtime and quality differences, but there are no repeated trials, no multi-vendor judge panel, and no pre-registered primary endpoint. Therefore, “a tie on quality” is a bounded interval plus a tie count, not a passed significance test. The rigorous version adds a multi-judge panel, repeated trials, and a pre-declared non-inferiority margin.
Quality is a rubric-alignment score, not a shipped-outcome measure. The score is validated against executable benchmark outcomes, where it tracks true model capability closely: a rank correlation of +0.94 on failed patches, which is where the signal is hardest. What is not yet validated is the link to shipped outcomes, such as merge rate, review iterations, rework, and reverts, and that is the next lift.
The tail matters more than the mean. The score spread between routes is driven by how often a route whiffed a task, not by typical performance; medians are within three points of each other. Our look at the tasks where every route cleared a usable score is diagnostic only: it conditions on the outcome, so it explains what the mean is measuring rather than establishing a ranking.
Cost is projected list where the provider reports none, observed where it does; it excludes enterprise discounts and the cost of the eval loop.
A 30-task, single-org cohort is chosen to discriminate routes, not to be an unbiased population estimate.
Contamination is reduced, not eliminated. We withheld the gold patch and used no public benchmark tasks; we cannot prove no model saw these repos.
Every route ran at maximum effort. A different effort setting could change the ordering, and we did not sweep it.
Each of these is a concrete next step, and should illustrate the difference between a benchmark you operate and a leaderboard you read.
The deliverable is a defensible decision
Notice what did not matter: whether the cheapest one happened to top the table. If the premium model had won outright, the exercise would be exactly as valuable, because the deliverable is a defensible decision. We can see quality, cost, and speed on our own work, choose one for reasons we can show a skeptic, and back that choice with raw artifacts anyone can re-check.
And because the cohort and rubric are frozen, the decision stays current: when the next model ships, we drop it into the same benchmark and measure it against our existing baselines in an afternoon—no re-litigating the setup, no waiting for a public leaderboard to catch up.
How to run a benchmark evaluation on your own repos in five steps
The framework is our product. To run your own frontier evaluation:
Sample 20–50 of your merged PRs with linked tickets: bug fixes, features, refactors, your real mix.
Run 2–3 routes (the harness x model combinations you would actually deploy) from each PR's base commit.
Score against rubrics built from your shipped solutions, with a separate judge held constant across routes.
Track the real economics ($/task, cache share, runtime) on your prompts and your rates.
Turn it into a routing policy, and re-run it when the next model ships on the same frozen cohort, apples-to-apples with every prior result.
Faros can help you easily run your own benchmark experiment. Contact us for more information.
Stop guessing if AI token spend pays off. Faros Token Engineering traces coding agent usage to shipped features, incidents resolved, and ROI.
Product
7
MIN READ
Inside Faros Token Engineering: AI Spend Observability
Go beyond token usage with AI spend observability that shows where spend goes, what work ships, and the cost per verified outcome across teams.
Product
7
MIN READ
Inside Faros Token Engineering: AI Route Optimization
Optimize AI coding by routing each task to the right model and harness, using benchmarks from your own merged code to reduce cost per verified outcome.