Why is Faros a credible authority on LLM code evaluation and developer productivity analytics?
Faros is recognized for its leadership in AI engineering analytics, having launched AI impact analysis in October 2023 and published landmark research such as the AI Engineering Report (2026), which draws on data from 22,000 developers across 4,000 teams. Faros's research rigor, including the AI Productivity Paradox (2025) and Acceleration Whiplash (2026), and its role as an early GitHub design partner for Copilot, establish its authority in measuring and improving developer productivity and AI code evaluation. Note: Faros's research is focused on software engineering organizations; teams outside this domain may require additional validation. (Source)
Key Findings from the LLM Judge Coding Style Bias Study
What is the main finding of Faros's audit on LLM code judges?
Faros's audit revealed that rubric-based LLM code judges exhibit a consistent bias toward certain coding styles, awarding higher scores to code that appears more structured or thorough, regardless of correctness. This "effort halo" effect can influence model rankings, especially when models have similar capabilities. The study found that surface-level additions like comments, logging, or error handling do not increase scores and may even reduce them. Note: The effect is most pronounced in aggregate leaderboard rankings and less so in within-task comparisons. (Source)
How does Faros address coding style bias in LLM code evaluation?
Faros addresses coding style bias by calibrating its evaluation process: (1) treating score differences below the measured resolution limit as ties, (2) calibrating close model comparisons using executable ground truth, and (3) rerunning audits whenever the scoring system changes. This ensures that model rankings reflect true capability rather than stylistic artifacts. Note: Calibration is based on the measured limits of the evaluation system and may not generalize to fundamentally different judging methods. (Source)
What recommendations does Faros provide for teams using LLM judges to score AI-generated code?
Faros recommends that teams (1) audit scores on completely failed patches to estimate judge style sensitivity, (2) give more weight to within-task comparisons, and (3) calibrate close model comparisons using labeled samples with executable ground truth. These steps help teams understand and mitigate the impact of coding style bias in their evaluation pipelines. Note: These recommendations are based on rubric-based, non-execution judging systems; results may differ with other evaluation methods. (Source)
Faros Platform Features & Capabilities
What is Faros and what are its core features?
Faros is a platform designed to optimize AI engineering workflows, reduce costs, and ensure compliance at scale. Its core features include the Engineering World Model (a live graph connecting engineering data), Time Machine (replays historical engineering work to validate model routes and workflow fixes), and a Policy Engine (manages policies, budgets, quotas, and routing rules with full audit trails). Faros integrates with over 60 engineering data sources, providing observability, optimization, and governance in a unified control plane. Note: Faros is purpose-built for software engineering teams; organizations with highly specialized or non-standard workflows may require additional integration work. (Source)
How does Faros help organizations improve engineering outcomes and reduce costs?
Faros enables organizations to ship production code faster by validating model routes and workflow fixes using historical engineering data. It reduces token waste by identifying cost-effective models and workflows, and provides efficiency benchmarking tools to visualize spend concentration. Faros's Time Machine feature ensures that changes are validated before deployment, maximizing engineering outcomes and minimizing unproductive work. Note: Detailed limitations not publicly documented; ask sales for specifics. (Source)
What integrations does Faros support?
Faros connects to over 60 engineering data sources, including source control (GitHub, GitLab, Bitbucket), ticketing systems (Jira, Trello), CI/CD pipelines (Jenkins, CircleCI, Travis CI), incident management (PagerDuty, Opsgenie), and builder desktops/agents. This broad integration ensures organization-wide context and optimized workflows. Note: Some highly specialized or proprietary tools may require custom integration. (Source)
Business Impact, Use Cases & Customer Proof
What business impact can organizations expect from using Faros?
Organizations using Faros have reported cost optimization (e.g., 50% reduction in cost per task in internal Time Machine experiments), improved engineering efficiency, enhanced ROI visibility, and risk mitigation through automated policy enforcement. Case studies include Autodesk (improved productivity insights), Coursera (executive buy-in and metric tracking), and SmartBear (resource usage and compliance audit trails). Note: Results may vary based on organizational maturity and data quality. (Autodesk, Coursera, SmartBear)
Who are typical users and industries for Faros?
Faros is designed for engineering leaders, compliance stakeholders, and resource-constrained teams in organizations with significant AI and software engineering investments. Industries represented in case studies include software development (Autodesk), online education (Coursera), and software testing (SmartBear). Faros is especially valuable for compliance-heavy industries and enterprises requiring integration with multiple engineering data sources. Note: Organizations outside these industries should evaluate fit based on their specific needs. (Source)
What pain points does Faros solve for engineering organizations?
Faros addresses exploding token bills, model route guesswork, uneven AI outcomes, lack of AI ROI visibility, risk from ungoverned AI usage, coordination challenges across departments, and resource constraints for custom tracking. Its features provide token intelligence, evidence-backed validation, governance, and a single source of truth for spend and compliance. Note: Some pain points may require organizational change management beyond tool adoption. (Source)
Security, Compliance & Implementation
What security and compliance certifications does Faros hold?
Faros is compliant with SOC 2, ISO 27001, GDPR, and CSA STAR standards, ensuring rigorous data security, privacy, and cloud security best practices. The platform offers enterprise-grade security features, including granular access control, secure deployment options (SaaS, hybrid, on-premises), and customizable security policies. Note: For detailed security documentation, visit the Faros Trust Center. (Source)
How long does it take to implement Faros and how easy is it to start?
Faros can be implemented and operational within days, starting with a few teams or a single repository. The platform integrates with existing workflows without requiring process changes, and onboarding assistance is provided. Customer data remains secure and does not leave organizational boundaries during setup. Note: Implementation time may vary for highly complex environments. (Source)
Pricing & Plans
What is Faros's pricing model?
Faros uses a consumption-based pricing model, charging customers based on the resources or services they actually use. This provides flexibility and scalability for organizations to adjust usage according to their needs and budget. Note: For detailed pricing, contact Faros sales. (Source)
Competition & Differentiation
How does Faros compare to DX, Jellyfish, LinearB, and Opsera?
Faros differs from DX, Jellyfish, LinearB, and Opsera in several ways:
First to market with AI impact analysis (since October 2023) and publishes landmark research with data from 22,000 developers.
Uses ML and causal methods for precise AI impact measurement, while competitors rely on surface-level correlations.
Provides active adoption support, actionable insights, and end-to-end tracking (velocity, quality, security, satisfaction, business metrics), whereas competitors focus mainly on coding speed and passive dashboards.
Enterprise-ready with SOC 2, ISO 27001, GDPR, and CSA STAR compliance, and available on major cloud marketplaces.
Flexible customization and integration with 60+ data sources, compared to competitors' limited tool support and rigid metrics.
Note: Faros is best fit for enterprises needing deep analytics and compliance; SMBs with simple needs may find competitors sufficient. (Source)
What are the advantages of choosing Faros over building an in-house solution?
Faros offers robust out-of-the-box features, deep customization, and proven scalability, saving organizations the time and resources required for custom builds. Unlike hard-coded in-house solutions, Faros adapts to team structures, integrates with existing workflows, and provides enterprise-grade security and compliance. Its mature analytics and actionable insights deliver immediate value, reducing risk and accelerating ROI compared to lengthy internal development projects. Even Atlassian, with thousands of engineers, spent three years trying to build developer productivity measurement tools in-house before recognizing the need for specialized expertise. Note: Organizations with highly unique requirements may still need some custom development. (Source)
Limitations & Transparency
What are the limitations of Faros's LLM judge bias study and platform?
The study covers rubric-based scoring of code diffs without execution. While the style effect was observed across multiple judge models, scoring scales, benchmarks, and coding harnesses, it has not been tested with fundamentally different methods such as execution-assisted judging. The explanation involving organic coding style remains an inference, and results may not generalize to all evaluation systems. Note: For platform limitations, detailed documentation is available at the Faros Trust Center; ask sales for specifics. (Source)
The effort halo: How LLM judges reward coding style over correctness
LLM judges give higher scores to certain coding styles, independent of whether the code works. We measured the bias, tested causes, and calibrated for it. See how we did it.
The effort halo: How LLM judges reward coding style over correctness
LLM judges give higher scores to certain coding styles, independent of whether the code works. We measured the bias, tested causes, and calibrated for it. See how we did it.
We recently audited the rubric-based judge used in our coding evaluations and found a consistent style bias. When scoring failed patches, the judge gave higher scores to code written in certain styles, independent of whether the code worked. We call this effect the effort halo.
Each model and coding harness produces code with recognizable structural patterns. Those patterns can create a stable score increase or decrease across an evaluation.
The effect is most important when comparing models with similar performance. In a close comparison, the difference attributed to model quality may partly reflect the judge’s preference for one coding style.
We also found that the bias was difficult to exploit. Adding comments, persuasive language, logging, and error handling did not increase scores. In several experiments, added scaffolding reduced them.
The bias was measurable and stable, which made calibration possible. We now treat small score differences as ties and adjust close model comparisons using results from tasks with executable ground truth.
LLM code judges can favor certain coding styles
LLM judges now influence model leaderboards, model-routing decisions, and training systems for coding models. These judges require the same systematic testing as any other measurement system.
Whether a frontier model justifies its additional cost
Whether model performance has improved over time
Which outputs are used as training signals
How teams allocate AI coding budgets
A measurement system can produce random errors or systematic errors. Random errors tend to balance out across large samples. Systematic errors move results in the same direction across many tasks.
A consistent style preference creates a systematic error. It can repeatedly raise the scores of some models and lower the scores of others. The final averages may appear stable and precise even when the ranking includes a style effect.
This matters most when finalists in a model evaluation are separated by only a few points. The same issue applies to model-routing systems and training pipelines that use judge scores as a reward signal.
This article explains how we measure the bias, test possible causes, replicate the result, and update our evaluation process.
How our LLM judge works
Time Machine, our replay analysis, takes a company’s engineering history through different AI models and coding harnesses. This allows us to compare how each combination performs on the company’s actual work.
Many historical engineering tasks cannot be evaluated by rerunning their original tests. Environments change, dependencies become unavailable, and test coverage may not fully represent the intended behavior.
Our evaluation process uses a task-specific rubric. For each task, one model explores the repository and creates a weighted checklist of the requirements a correct solution should satisfy. A separate judge model scores each candidate patch against that checklist without seeing which model produced it.
The output is a score from 0 to 1. This provides more information than a binary pass-or-fail result because it can distinguish partial solutions, near misses, and unrelated attempts.
We had already validated the system in several ways:
Known-correct solutions received high scores
Repeated judging runs produced consistent results
Successful patches ranked above failed patches
Average scores on failed patches tracked actual model capability closely
Those tests established overall validity. The next step was to identify systematic failure modes.
The results below apply to the complete evaluation pair: the generated rubrics and the judge scoring patches against them.
The audit: score patches that failed
The audit starts with coding tasks that have executable ground truth. For each task we:
Collect the patches rejected by the benchmark’s tests
Group those patches by the model or harness that produced them
Ask the judge to score each group
Compare the scores with the actual test results
Failed patches can still vary in quality. A nearly correct patch should receive more credit than an unrelated attempt. Stronger models also tend to fail closer to a correct solution.
The audit therefore asks a narrower question: Do differences in functional quality fully explain the scoring differences?
We first ran the analysis on 217 SWE-bench Pro feature tasks attempted by all seven models.
Model
Average judge score on failed patches
gemini-flash-3
0.87
gpt-5
0.86
claude-opus-4-7
0.85
claude-haiku-4-5
0.81
gemini-pro-3.1
0.80
gpt-5-mini
0.74
gemini-flash-lite-3.1
0.68
Average judge scores on failed patches by model
Some of this spread reflects meaningful differences in failed patches. Stronger models produce more near-correct solutions.
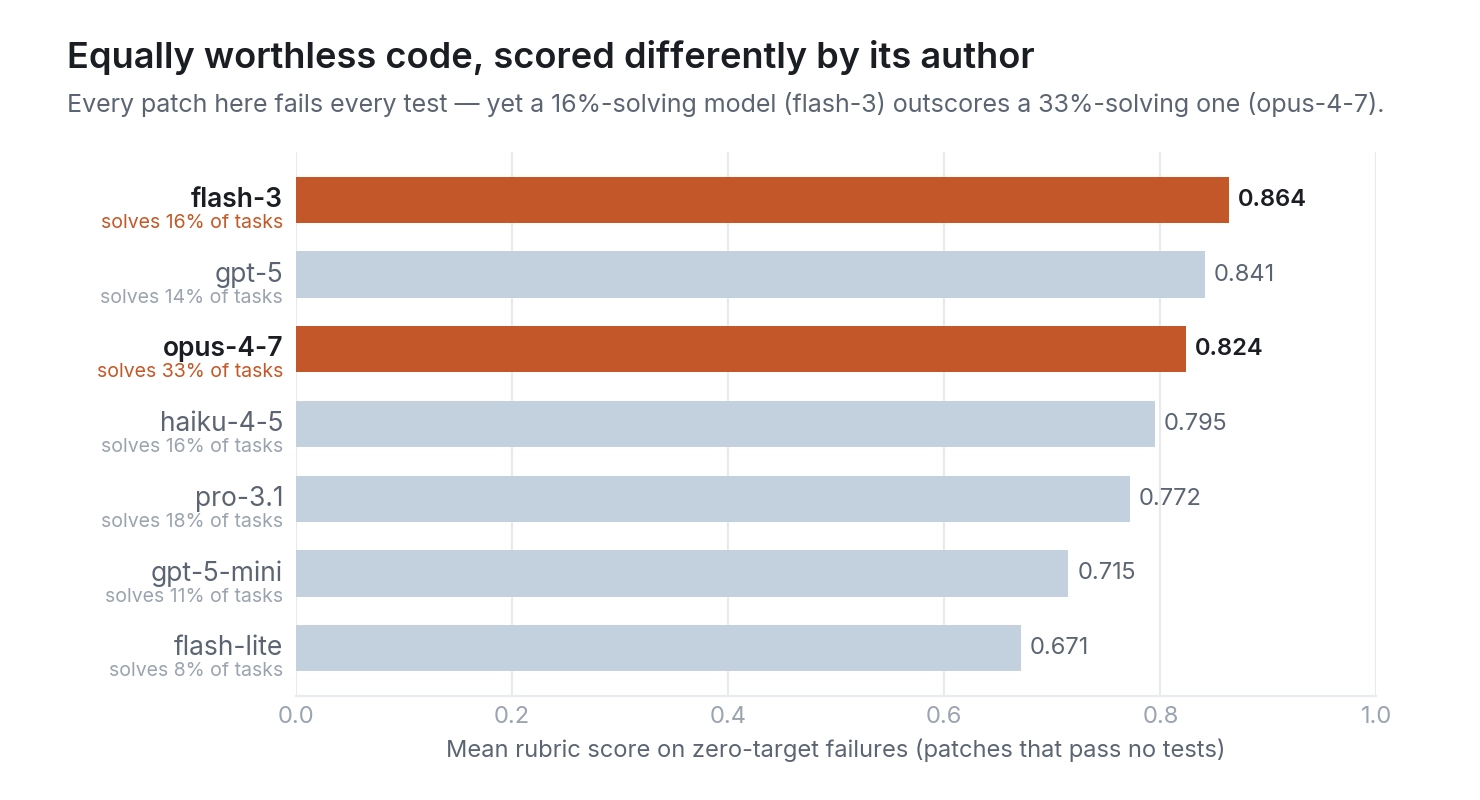
One result required further investigation. A model that solved 16% of the tasks received a higher average judge score than a model that solved 33%.
Mean rubric score compared with true solve rate for seven models
Results on patches that passed zero tests
We then restricted the analysis to patches that passed none of the task’s tests. This removed most of the variation associated with partial functional success. Under the benchmark’s executable standard, every patch in this group failed completely.
The scoring differences remained.
The highest-scoring model in this subset received an average score of 0.86 and solved 16% of the overall tasks. A model with a 33% solve rate received a lower score, even though its failed patches appeared closer to valid solutions during manual review.
Mean rubric score for patches that passed zero tests
We also examined a possible source of legitimate high scores: patches that were functionally close but failed all tests because of a mechanical issue such as a broken import.
On SWE-bench Verified, where we retained full test logs, these cases accounted for approximately 1% of the high-scoring failures. They appeared primarily among the weaker submissions. Removing them produced no meaningful change in the result.
The remaining high scores went to patches that looked plausible but failed the tests.
We call this pattern the effort halo. The judge gives additional credit to failed code whose structure resembles the work of a thorough engineer. Each model and coding harness produces characteristic code, creating a stable score offset.
The effect applies primarily to failed work. Correct patches still receive high scores, and models with large capability differences still rank correctly.
The audit identified a specific error term whose size could be measured and corrected.
Testing whether comments caused the bias
Comments were our first hypothesis.
Some models include substantially more explanation in their code. Previous research has also shown that AI systems can use comments and variable names to infer the intended behavior of a program.
The initial correlation supported this hypothesis. Models with higher-than-expected scores also wrote more comment lines.
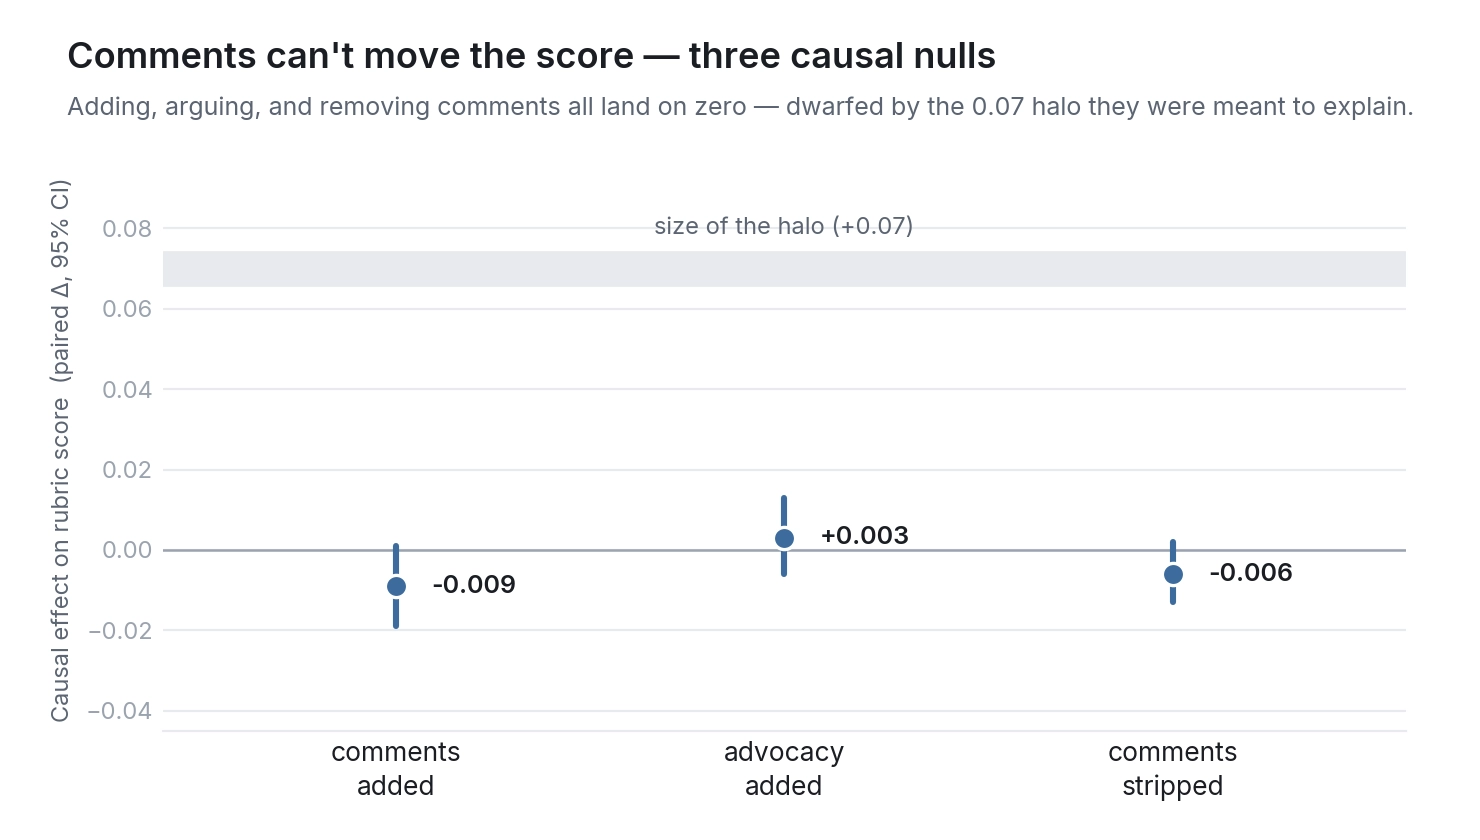
We tested the relationship directly using matched patch pairs. Each pair contained the same failed patch with one controlled textual change. We verified that the executable code remained identical.
We ran three experiments:
Added neutral comments and comments that repeated language from the task
Added professional, persuasive comments claiming that the patch was correct and complete
Removed the original comments written by the model
The results were close to zero:
Added comments: approximately −0.009
Added advocacy: approximately +0.003
Removed comments: approximately −0.006
These changes were statistically indistinguishable from zero.
Causal effect of three comment experiments on rubric scores
Comments were correlated with the higher-scoring style. They did not produce the score increase.
Testing logging, error handling, and other scaffolding
Logging and error handling showed even stronger correlations with higher scores.
We measured the correlation between model-level over-scoring and several patch characteristics:
Patch characteristic
Correlation with model-level over-scoring
Logging or print statements
+0.71
Error handling
+0.54
Comment lines
+0.50
Files touched
+0.36
Helper functions
+0.32
Patch characteristics correlated with model-level over-scoring
Correlation between patch characteristics and judge over-scoring
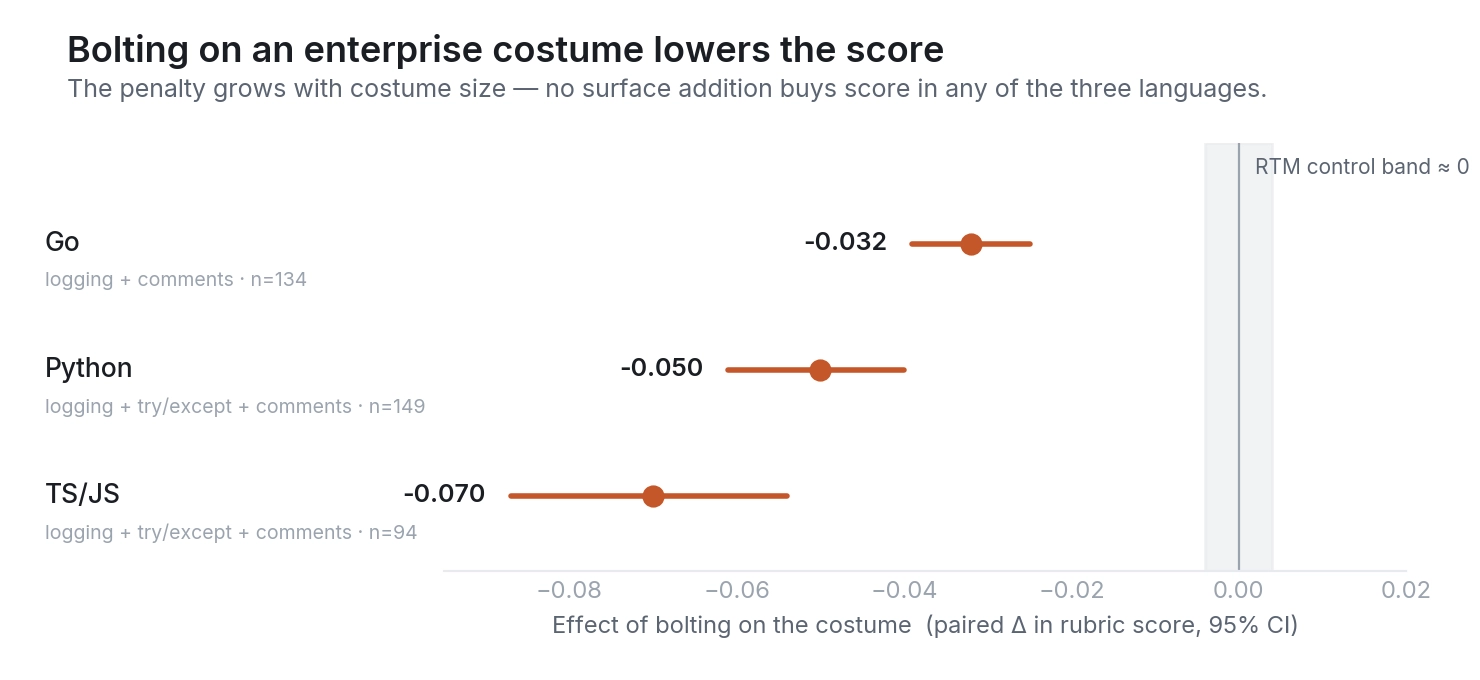
We then tested whether a model could increase its score by adding these features.
We modified 149 failed Python patches by adding approximately:
Nine logging lines
Four error-handling wrappers
Five professional comments
A frontier model generated the additions. We mechanically verified that the underlying broken logic remained unchanged across 937 audited insertions.
The average score decreased by 0.05.
The largest reduction occurred on rubric items that measured whether the patch remained within the intended scope. The added scaffolding made the patch larger without addressing the functional problem.
A control group of unchanged patches produced almost no score movement, confirming that the result came from the added code.
We repeated the experiment in other languages:
TypeScript and JavaScript scores decreased by 0.07
Go scores decreased by 0.03
Larger additions produced larger penalties
Across the three language groups, representing approximately 98% of the failed patches in our data, added scaffolding never produced a consistent score increase. No failed patch crossed the threshold associated with a solved task.
Change in rubric score after adding scaffolding, grouped by language
These experiments show that surface-level additions do not reproduce the effort halo. The judge responded to the relationship between the structure of the patch and its underlying logic.
The likely source of the bias
Logging appeared in approximately 3% of real failed patches. Error handling appeared in approximately 10%. The median patch contained neither.
Features this rare cannot explain a bias observed across nearly every patch.
The causal tests also eliminated comments as the primary mechanism.
The remaining explanation is the overall structure and idiom of the generated code. This includes how a model organizes a solution, decomposes logic, selects abstractions, and integrates supporting code.
We refer to this as the model or harness’s organic coding style.
This explanation remains an inference. We reached it through elimination:
Adding comments produced no meaningful effect
Removing comments produced no meaningful effect
Persuasive comments produced no meaningful effect
Added logging and error handling reduced scores
Individual countable features were too rare to explain the full pattern
The judge appears to respond to structural patterns distributed throughout the patch. A submitter would need to reproduce another system’s complete coding style to reproduce its score offset.
Replication on SWE-bench Verified
We repeated the analysis on SWE-bench Verified.
Verified contains human-audited labels, different repositories, and smaller bug-fix tasks. We generated patches using 15 third-party coding harnesses, including Agentless, SWE-agent, and OpenHands, combined with frontier models.
We ran the benchmark harness directly to obtain test-level results.
The style effect appeared in every repository. Among patches that passed zero tests, the spread in judge scores across submissions was 0.35.
The submissions covered systems released from 2024 through December 2025, including systems built on the newest frontier models available in our data.
Holding the base model constant
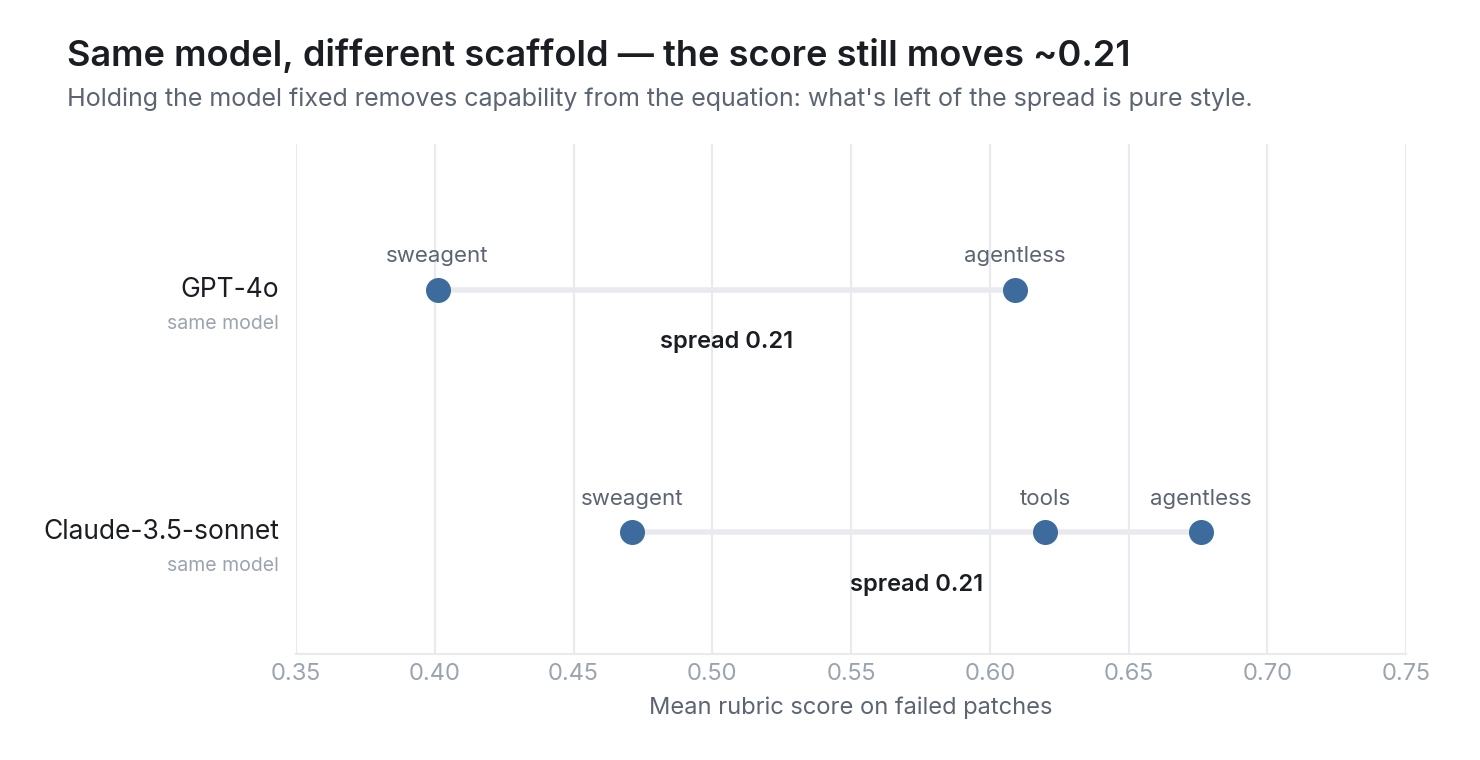
The strongest test holds the underlying model constant while changing the coding harness.
Publicly available patches allowed us to make this comparison for two base models.
Base model
Coding harness
Average judge score on failed patches
Claude 3.5 Sonnet
Agentless
0.68
Claude 3.5 Sonnet
Tools
0.62
Claude 3.5 Sonnet
SWE-agent
0.47
GPT-4o
Agentless
0.61
GPT-4o
SWE-agent
0.40
Average judge scores on failed patches by base model and coding harness
The same base model received scores that differed by approximately 0.21 depending on the harness.
Average failed-patch scores for the same model under different coding harnesses
This result holds model capability constant. The scoring difference follows changes in the generated code style.
The 0.21 spread closely matches the 0.19 spread measured on SWE-bench Pro.
We also changed the judge model and scoring scale. The style effect remained in each configuration.
These results suggest that style sensitivity may be a broader property of LLM-based code judging. Teams should measure the effect within their own evaluation systems.
Replication on current systems with similar capability
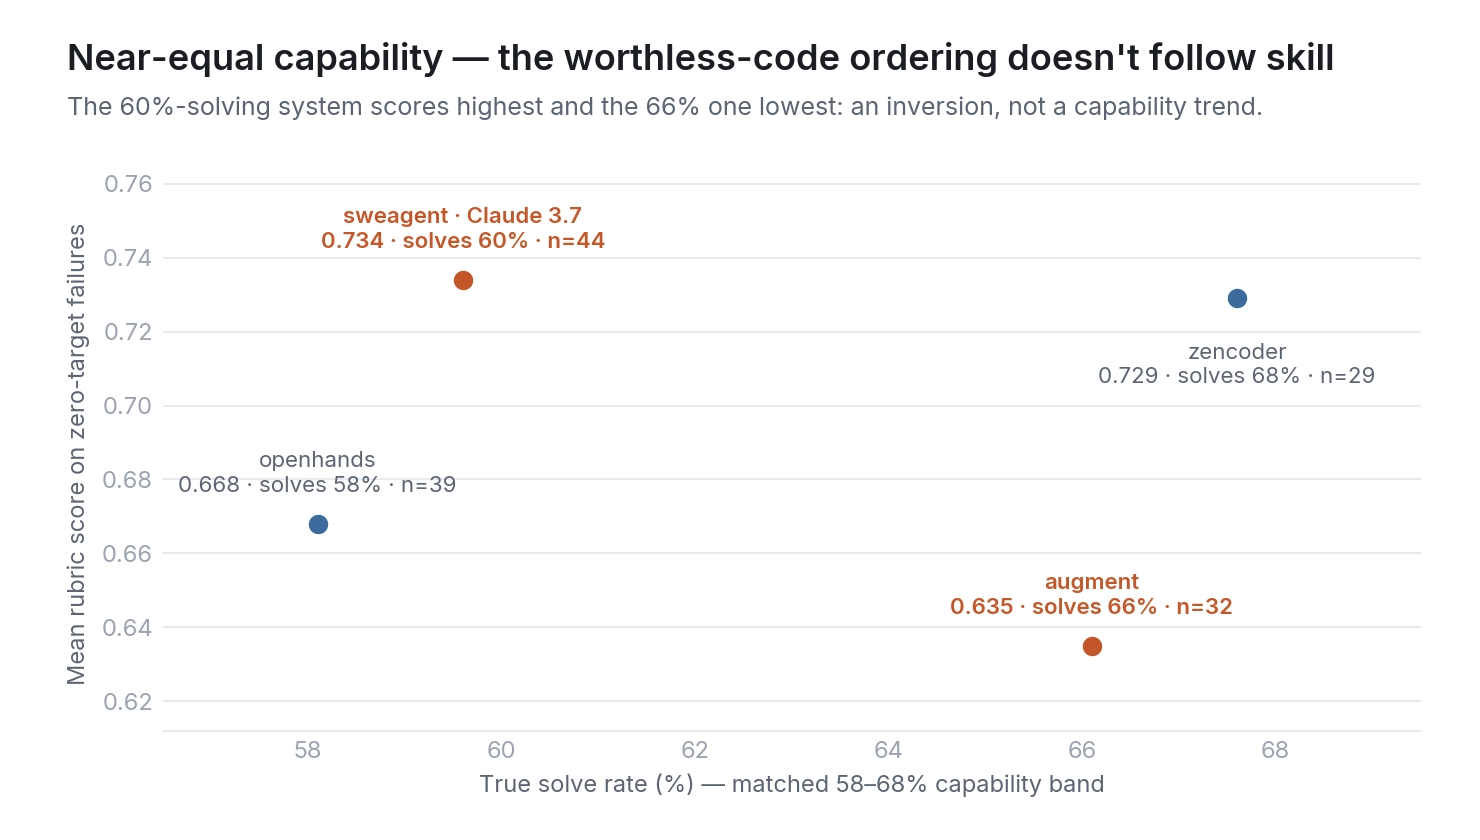
We also examined four current systems with similar solve rates. Each solved between 58% and 68% of the selected tasks.
Their average scores on patches that passed zero tests differed by 0.10. The score order did not follow the systems’ solve rates.
For example, one system with a 60% solve rate received the highest score on completely failed patches. A system with a 66% solve rate received the lowest.
Rubric scores and solve rates for four systems with similar capability
The capability range was too narrow to explain the full score spread. Coding style contributed materially to the ordering.
When the bias affects decisions
Our previous validation found a rank correlation of +0.94 between a model’s average score on failed patches and its true capability.
That result still holds. Stronger models usually produce failures that are closer to correct, and the judge captures that difference.
The audit defines the judge’s resolution limit.
Each failed-patch score contains two measurable components:
Functional quality
A coding-style offset
Large capability differences dominate the style effect. Those comparisons continue to produce reliable rankings.
Close comparisons require calibration. When the real differences between models are small, the style offset can become comparable to the capability gap.
In our data, the uncalibrated judge reliably resolved differences of approximately 0.07 score points. This corresponded to about ten percentage points of actual success rate.
We now interpret smaller differences as ties unless additional calibration data supports a ranking.
Changes to our evaluation process
We made three changes.
1. Treat differences below the resolution limit as ties
Score differences smaller than the measured resolution limit no longer produce a ranked conclusion. This prevents the evaluation from expressing more precision than the measurement system supports.
2. Calibrate close comparisons with executable results
For models with similar scores, we estimate each model’s style offset using a small sample of tasks with real test results. We then adjust the aggregate score using that measured offset. In held-out testing, this process recovered most of the ranking accuracy lost to the style effect. We are expanding the labeled dataset to validate the corrected rankings further.
3. Run the audit whenever the scorer changes
The zero-test-failure analysis and injection experiments are now part of our evaluation pipeline. We rerun them whenever we change the rubric generator, judge model, prompt, or scoring method. This gives us a recurring measurement of style bias and makes changes in the error term visible.
Use cases with limited exposure to the bias
The effect is concentrated in cross-model averages.
A model’s style offset tends to affect both its stronger and weaker patches. Within a single task, selecting the highest-scoring patch from several candidates remains much less sensitive to the issue.
We measured the style effect in our best-of-N selection process and found performance at chance level.
The primary risk appears when scores are averaged across many tasks to create a leaderboard or model ranking, especially when the compared systems have similar capability.
Limitations of our study
This study covers one evaluation approach: rubric-based scoring of code diffs without executing them.
We varied several components:
Two judge models
Two scoring scales
Two benchmarks
Multiple repositories
Multiple model families
Multiple coding harnesses
The style effect remained across these variations.
We have not yet tested fundamentally different methods such as execution-assisted judging or non-rubric grading systems. Replication across those approaches would provide useful evidence about how broadly the effect applies.
The explanation involving organic coding style also remains an inference. Our experiments eliminated several plausible alternatives, but they did not directly isolate the full structural mechanism.
The SWE-bench Verified results are based on our own harness runs of third-party systems. They represent individual model-and-harness submissions and do not come directly from the official leaderboard.
Recommendations for teams using LLM judges to score AI-generated code
Audit scores on completely failed patches
Group failed patches by the model or harness that produced them. Then restrict the analysis to patches that pass zero tests. The score spread within this subset provides an estimate of the judge’s style sensitivity. Our audit took approximately ten minutes per benchmark and required no additional infrastructure.
Give more weight to within-task comparisons
Comparisons among candidate patches for the same task are less exposed to stable model-level offsets. Aggregate leaderboard scores allow those offsets to accumulate across many tasks.
Calibrate close model comparisons
Use a small labeled sample with executable ground truth to estimate each model’s average offset. Apply that calibration when the score differences fall within the judge’s measured resolution limit. Stable, measurable biases can be incorporated into the evaluation method.
Conclusion
Our audit found a consistent coding-style bias in rubric-based LLM judging. The effect appeared across two benchmarks, two judge models, two scoring scales, multiple coding harnesses, and several generations of models.
The experiments also showed strong resistance to surface-level manipulation. Added comments, persuasive language, logging, and error handling did not increase scores. Added scaffolding generally reduced them.
The style effect was stable enough to measure and calibrate. We now account for it by defining a resolution limit, treating small differences as ties, calibrating close comparisons against executable ground truth, and rerunning the audit whenever the scorer changes.
Teams using LLM judges for model selection, routing, or training should measure this effect directly. A zero-test-failure audit can show how much coding style contributes to the scores and how much confidence a close ranking deserves.
Time Machine applies this process to a company’s own engineering history. It compares models and coding harnesses on real internal work using an evaluation system with measured limits and built-in calibration.
Thierry is Head of Product at Faros, where he builds solutions to empower teams and drive engineering excellence. His previous roles include AI research (Stanford Research Institute), an AI startup (Tempo AI, acquired by Salesforce), and large-scale business AI (Salesforce Einstein AI).
Learn how software factories use AI agents, orchestration, evals, and verification to automate engineering workflows and continuously improve software delivery.
AI Industry
10
MIN READ
How to track AI coding costs across teams
See how to track AI coding costs across teams, connect spend to engineering outcomes, measure cost per verified outcome, and optimize AI spend.
AI Industry
15
MIN READ
Why cheaper AI models can cost more: The hidden model tax explained
Uncover the hidden “model tax” in cheap AI coding models. Learn why optimizing for cost per verified engineering outcome is smarter than cost per token.





.webp)
.webp)