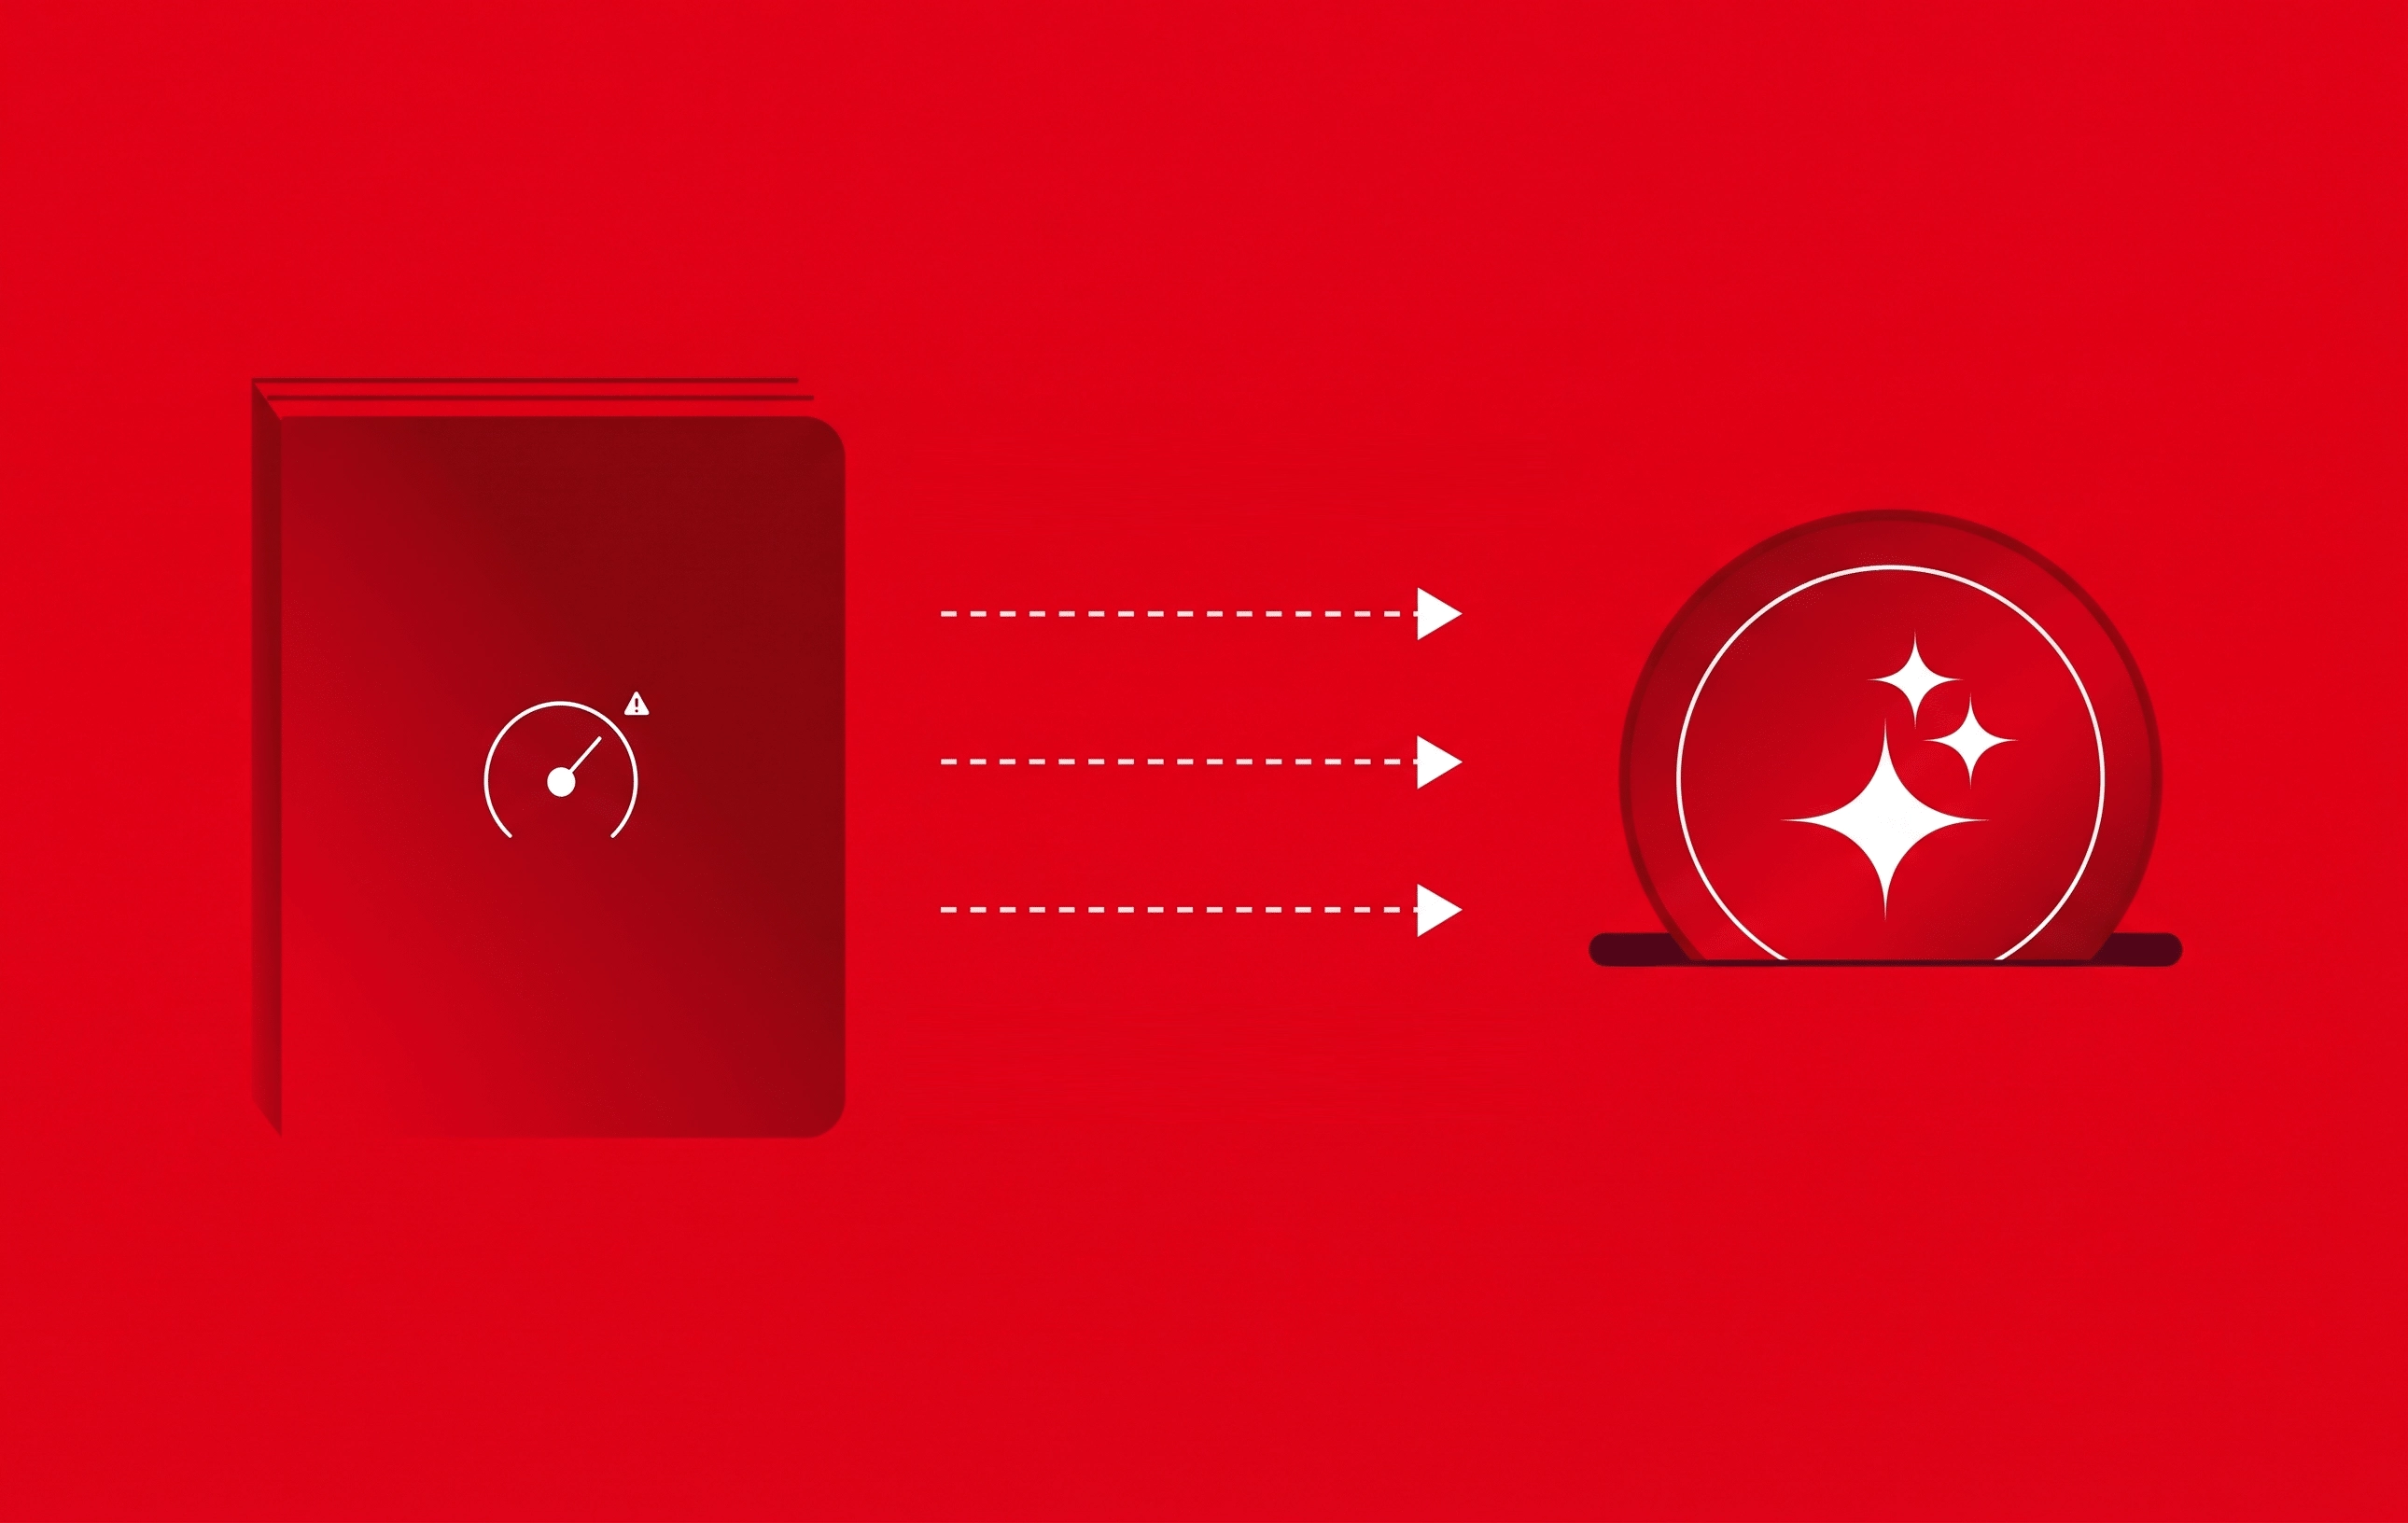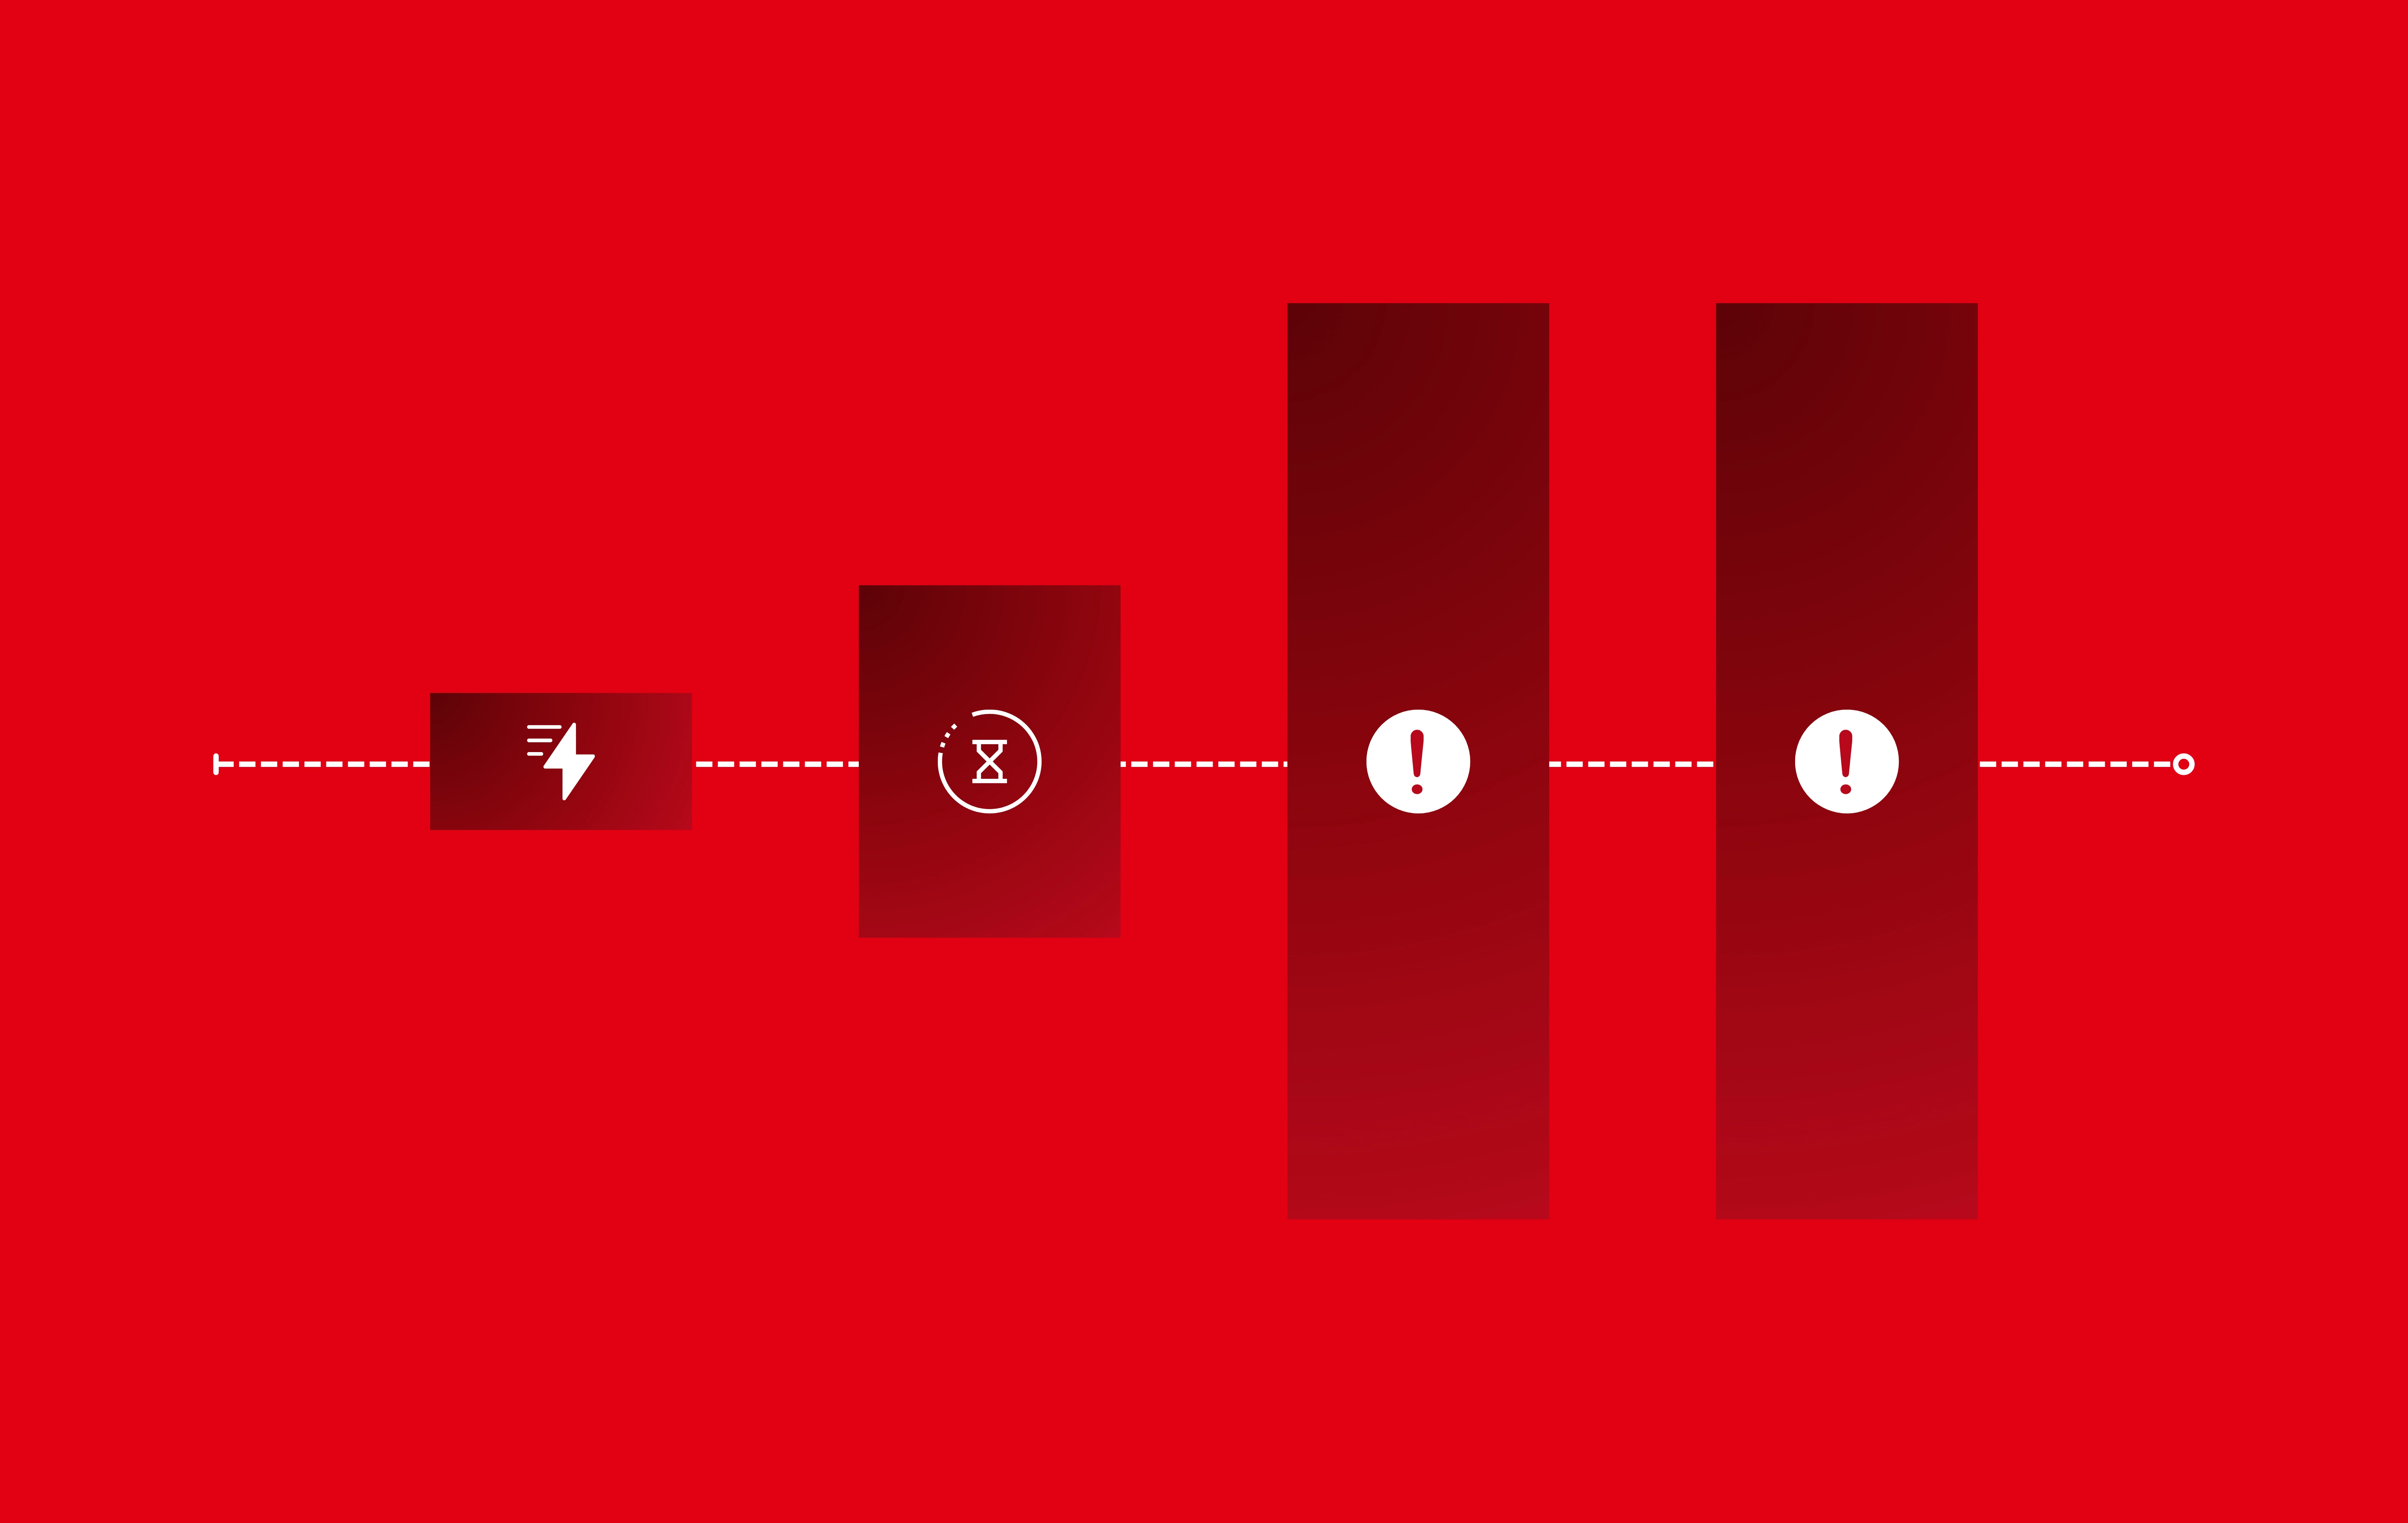

OpenAI says 30% of SWE-Bench Pro is broken. Our LLM judge had already flagged the evidence.
Last week, OpenAI published an audit of SWE-Bench Pro, a popular AI coding benchmark, and estimated that roughly 30% of its tasks are broken—most often because the hidden tests are stricter than the task actually asks.
We read that post with particular interest, because a few weeks earlier, while validating our own execution-free judge against that same benchmark, we had hit a cluster of cases we couldn’t explain away: patches our judge scored highly that the benchmark’s tests failed.
We treated every one of those disagreements as our error and investigated them as such. Some of them were. But one recurring pattern wasn't: functionally valid patches that solved the task in a different way than the official fix. The tests, written for that one implementation, rejected them anyway.
OpenAI’s audit now gives that pattern a name and a base rate. This post is about what a graded, execution-free score sees that a binary test verdict structurally cannot, and why disagreement between two metrics is sometimes the most useful data you have.
Why should you care? Because choosing the best AI model has become a budget decision in addition to a technical one—and benchmark numbers are often the default evidence for these decisions. Which model to route your team’s coding work to, whether the expensive frontier model earns its premium, whether “agents improved 3x this year” is capability or noise—all those decisions sit downstream of scores like SWE-Bench Pro’s. So, can you trust it? Read on.
We were auditing ourselves, not the benchmark
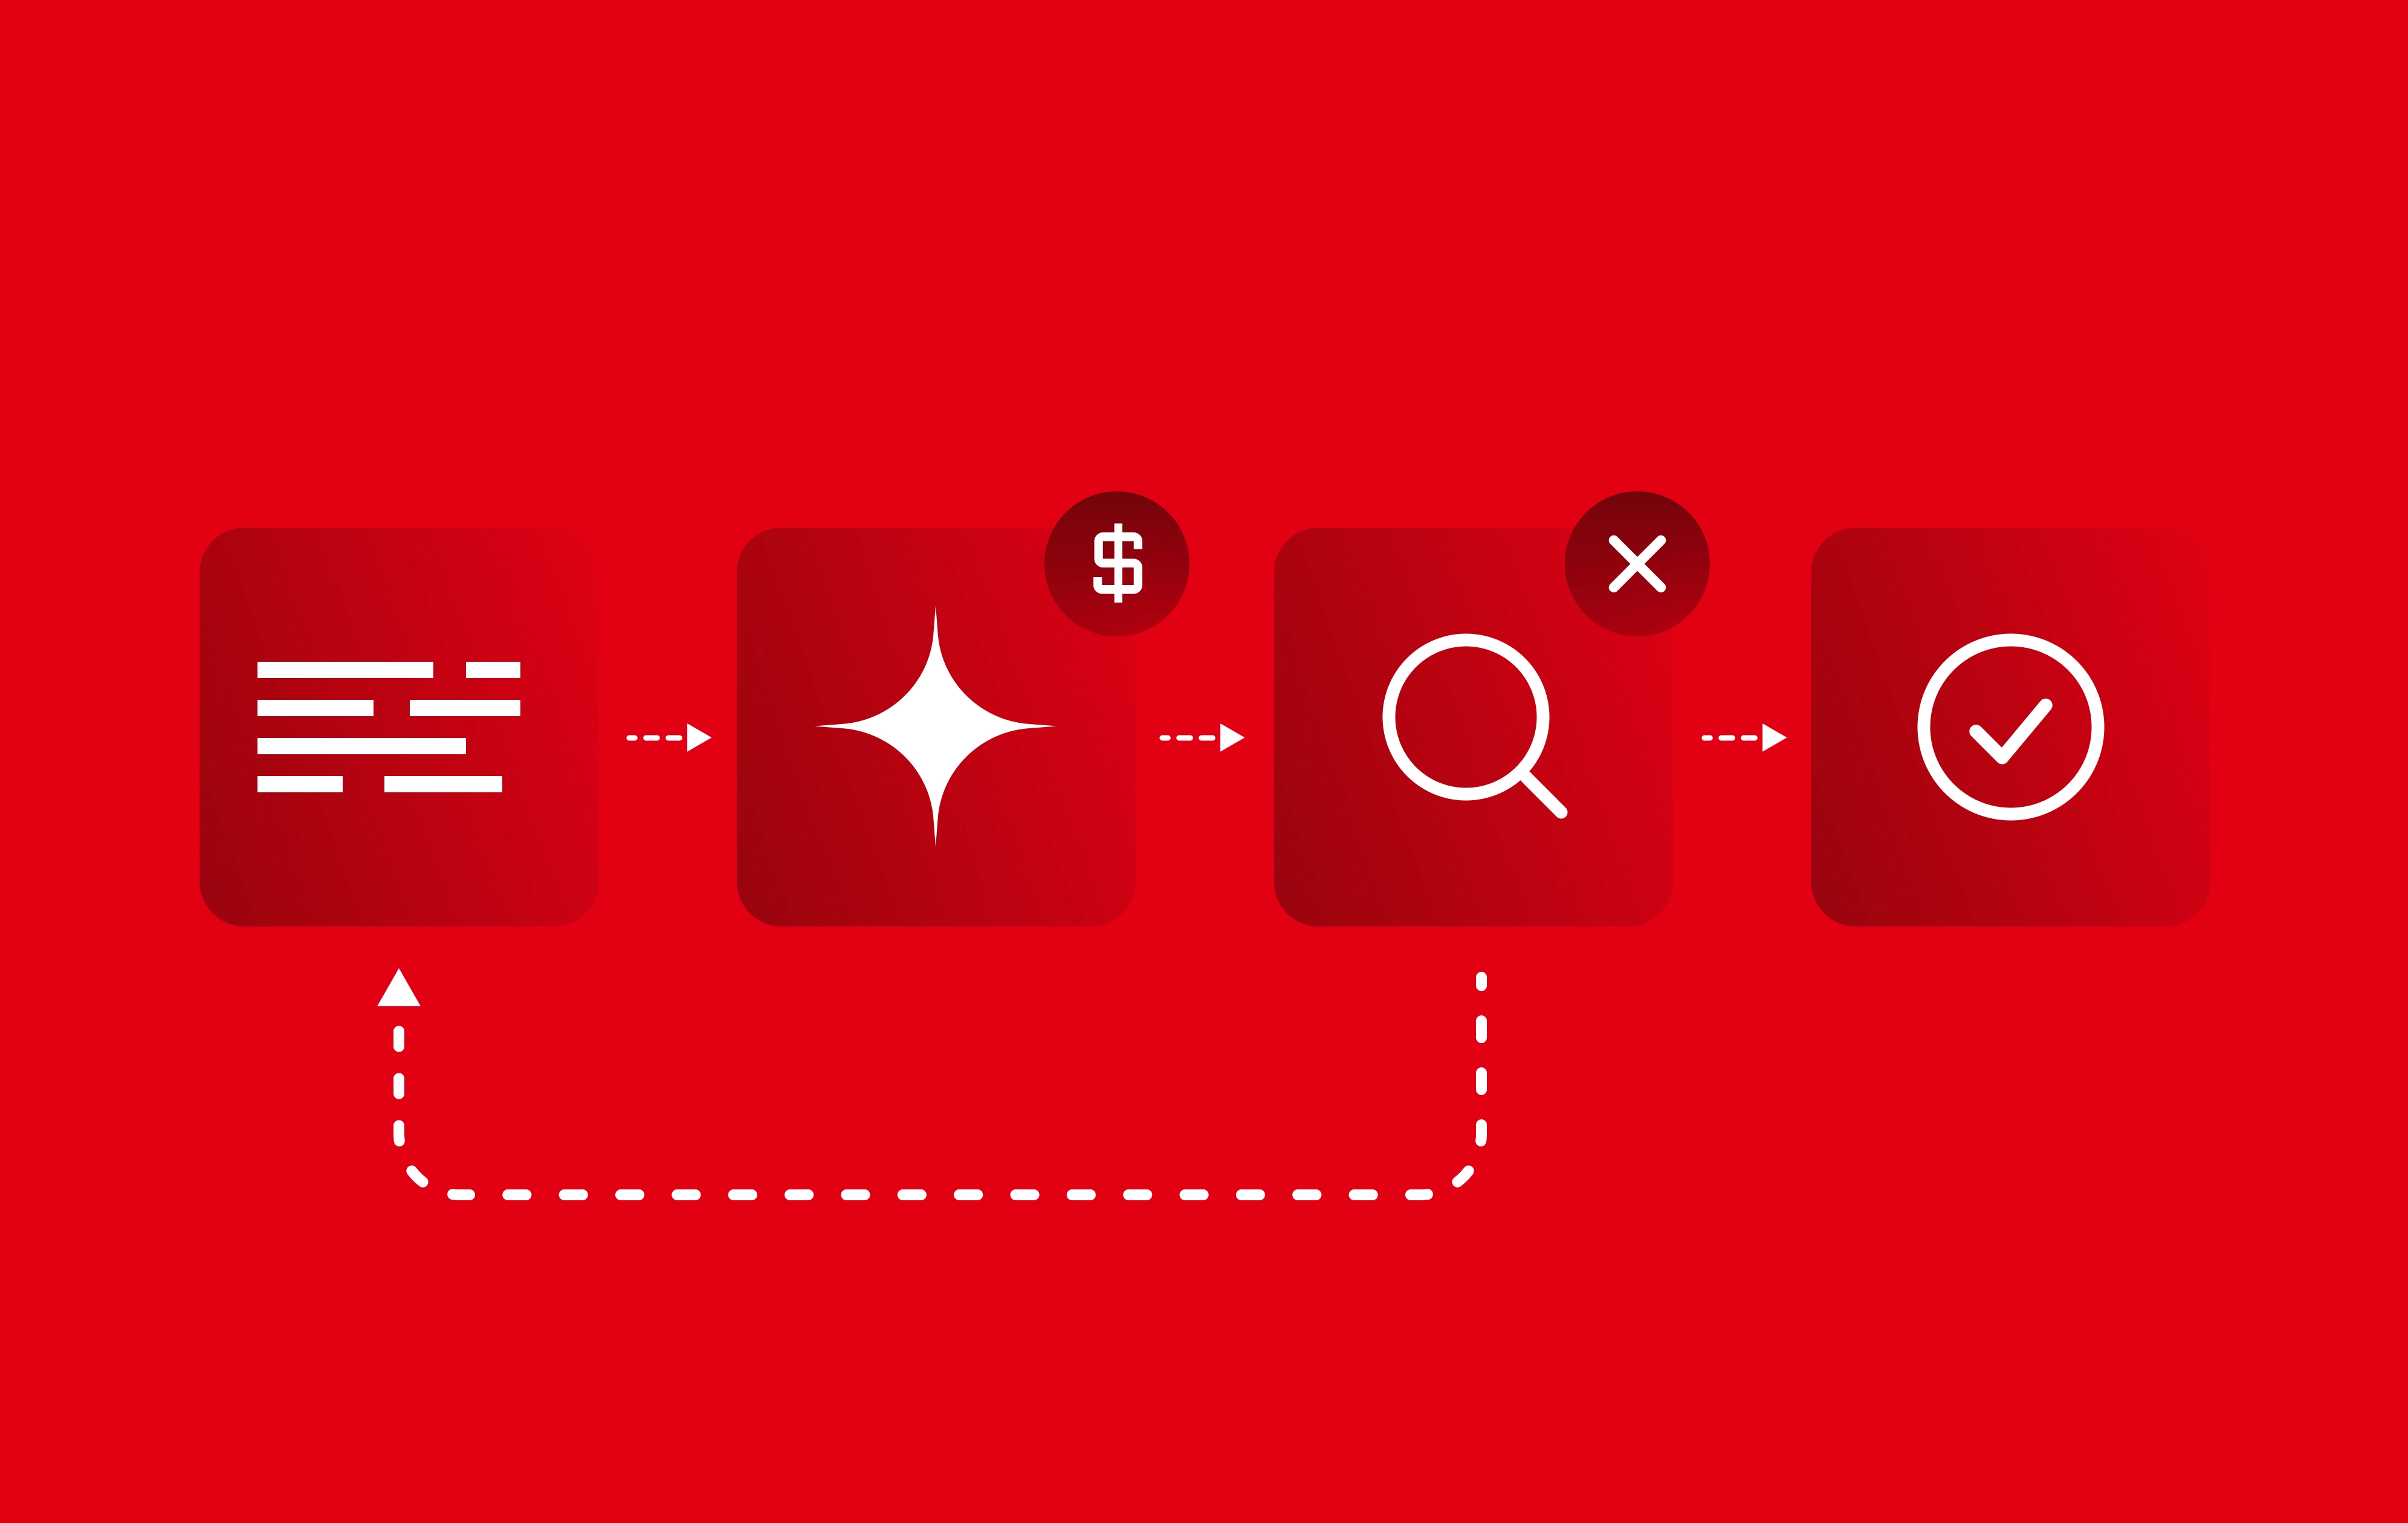
A quick recap for new readers: Our evaluation framework replays a company’s real engineering history, where tests usually can’t run. So instead of executing code, we build a per-task rubric (a weighted checklist of criteria grounded in the actual repository), and then a blinded LLM judge scores each candidate patch against it. The score is graded, 0 to 1, not pass/fail.
Part of our evaluation framework involves validating against public benchmarks where ground truth exists. We ran our judge over a subset of roughly 100 SWE-Bench Pro tasks, each with multiple alternative patches from different models, several hundred patches altogether. The point of this validation is to find our own mistakes.
The most suspicious pattern a judge can show is leniency: scoring patches highly that the test harness says failed. Every one of those is a potential false positive. So we did what you should do with a suspicious metric: we pulled the lenient cases and categorized them one by one to investigate further.

Reading 152 disagreements, one by one
Here’s how we did the reading. We took all 152 disagreement cases—every patch that failed the tests but scored above the average of the passing ones—and classified each one individually. For every case, an LLM analyst got access to:
- The candidate diff
- The official fix
- The task description
- The rubric with its item-by-item verdicts
- How the official fix scored on that same rubric
- The test results
Each case was labeled independently, with no analyst seeing another’s work.
We had shaped the categories in an earlier manual pass over a dozen cases, and one rule stayed fixed throughout, because every disagreement has two suspects: either the tests were wrong about the patch, or our rubric was wrong to score it highly.
To tell them apart, we use the official fix (where the solution is known to be correct) as a control, and score it on the same rubric. If the official fix scores well, the rubric recognizes correct work, and its verdict on the failing patch means something. If the official fix also scores poorly, the rubric is the broken instrument, and the case is charged to us. Without that rule, every disagreement could be conveniently blamed on the benchmark. One judgment per case means the exact percentages carry a few points of noise either way, but the shape of the distribution is stable.

The top two clusters are the most interesting to look at:
Near misses: right answer, zero credit (47%)
The near misses made up the larger cluster. These were patches that made real, substantial progress (correct root cause, correct fix) but then failed on something incidental, like a broken import. To the test harness, these are a flat zero, indistinguishable from an empty diff. Our judge scored them high, because most of the rubric was genuinely satisfied.
At first glance, that looks like leniency. It isn’t. It’s the difference between a graded instrument and a binary one. “Failed, but nearly shipped” and “failed, produced nothing” are different outcomes. A score that collapses them throws away exactly the information you need when comparing models on hard work, where even the best models fail often. This is the same property behind the strongest result in our previous post: the rubric score can recover a mode’s capability ranking from its failing patches alone.
Divergent designs: right solution, wrong shape (23%)
The divergent designs made up the second largest cluster, and the interesting one for this post. These were patches that were functionally valid solutions to the task but implemented differently than the official fix. The benchmark’s tests, written to validate one specific change, rejected them. Some of these “failed” patches score above the official fix on the same rubric.
Here, our judge and the harness weren’t disagreeing about quality. They were answering different questions.
The rubric asks: Does this patch do what the task requires?
The tests ask: Does this patch behave like the one specific patch we wrote tests for?
When a task admits more than one valid design, those questions come apart.
We could see this pattern clearly because we had multiple alternative patches per task. Looking at a task description alone, an over-strict test is hard to spot. Looking at five different attempts, including good ones that fail, the pattern jumps out.
The rest: our misses and the messy middle
The remaining clusters are smaller. The regressions-only cases (7%) are patches that passed every test for the requested change, but broke pre-existing tests along the way. This is accomplished work with real collateral damage, and one can disagree over whether that counts as progress (you would not merge that patch).
Two clusters are unambiguously ours: the mechanical breakages (12%) and the incomplete-or-stub cases (9%), which include broken imports, junk files, and placeholder logic presented as complete. Those are defects a careful reviewer reads right off the diff, and the judge credited them anyway.
Finally, there are the rubric defects (1%): two cases where the checklist itself was bad, caught by the official-fix control described above. So, altogether roughly three-quarters of the disagreements are the graded score doing its job on work the binary label erases, while about a fifth are our judge's misses that we had to keep working on.
We logged all of this as a finding about our validation setup and moved on. Then OpenAI published their audit.
OpenAI found the same thing from the other side
OpenAI’s audit reports an estimated ~30% of SWE-Bench Pro tasks have quality issues, and the single most common failure mode is tests that are overly strict; they enforce implementation details the task never specified, so functionally correct submissions fail. Their diagnosis of the root cause matches what we saw from the patch side: benchmark tasks are harvested from real repository history, and the tests in a merged PR were written to validate that PR, not to define an implementation-agnostic standard of correctness.
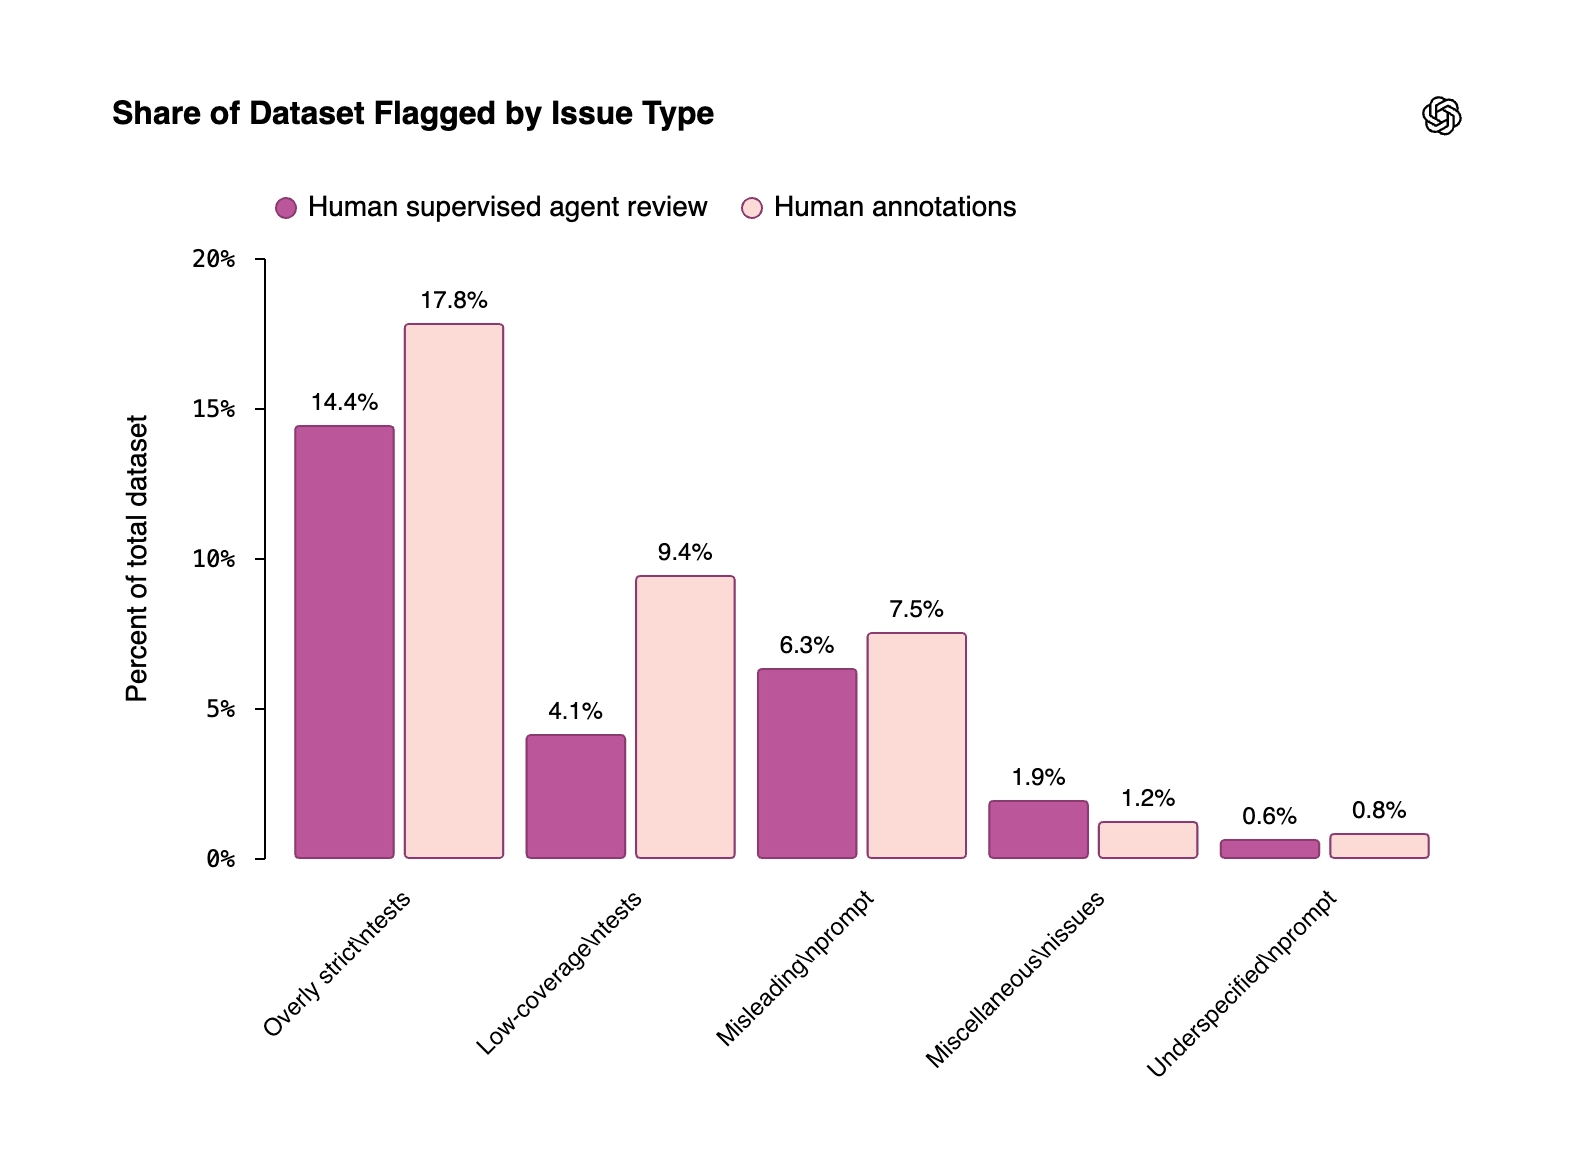
In other words: the divergent-design cluster we’d been staring at is their #1 failure category, seen from the opposite direction. They audited the tasks and predicted that valid alternative solutions would be rejected. We had the rejected valid solutions and worked back toward the tests.
What we’re not claiming
Two honesty notes, because this is where a post like this can overreach.
Our judge is not a benchmark auditor. It’s tempting to conclude that rubric/harness disagreement can be used as a broken-task detector—just flag every case where the two differ. We tested that idea, and it doesn’t work. Disagreement is spread too evenly to isolate broken tasks on its own, because the two instruments differ by design on every near miss, not just on broken tasks. A graded score disagrees with a binary one constantly, and most of that disagreement is the graded score doing its job.
Overlap is not reproduction. We looked at ~100 tasks through the lens of alternative patches; OpenAI audited the full benchmark with an investigator pipeline plus human annotation. The findings are aligned. The numbers are not comparable, and we’re not claiming ours confirms theirs.
What actually matters here
The deeper point in OpenAI’s post is structural: any benchmark built automatically from repository history inherits tests that were never meant to be a general standard of correctness. Their conclusion is that the industry needs evaluation approaches built deliberately for measuring AI coding work, with human oversight, rather than harvested from artifacts built for something else.
That’s the premise we started from. Real engineering work mostly can’t be scored by tests at all— whether the environments are gone or the coverage is thin—which is why we built a graded, execution-free score and then spent our effort proving it trustworthy rather than assuming the harness is. The lesson we took from this episode is about that proof: when your metric disagrees with the ground truth you’re validating against, the disagreements are not noise to minimize; they’re a sample worth reading one by one. Some of them will be your bugs, and some of them could be an issue of the supposed ground truth.
There’s a version of this that lands closer to home. SWE-Bench Pro is a curated benchmark: tasks were selected, tests were checked, thousands of researchers have run it—and it still carries an error rate near 30%.
Now consider what happens when you evaluate AI agents on your own engineering backlog, which is what more and more teams are doing.
Your ticket descriptions were written for a colleague who had context, not as complete specifications.
Your tests were written to validate one specific change, not to define correctness.
Nobody has audited any of it.
An uncurated task set inherits every failure mode OpenAI documented, at a higher rate, with no annotation campaign to catch it. So when an agent “fails” 60% of your historical tickets, some real fraction of that number is your task set, not the agent—and a single binary verdict per task will never tell you which.
The practical takeaways are the same ones we applied to ourselves: score work on a gradient so that near misses are visible, use more than one measure, and treat the disagreements as the reading list.
At Faros, this score is what powers Time Machine. We replay your engineering history to measure which models and harnesses handle your work best—on your repositories, your task mix, and your review standards, including all the work no test suite can reach. And because we read the disagreements instead of discarding them, the same replay tells you something about your task set itself: where your tickets under-specify, where your tests over-constrain. That turns a benchmark-quality problem into an engineering insight. Contact us for a demo.