Claude Code token limits: Guide for engineering leaders
You can now measure Claude Code token usage, costs by model, and output metrics like commits and PRs. Learn how engineering leaders connect these inputs to leading and lagging indicators like PR review time, lead time, and CFR to evaluate the true ROI of AI coding tool and model choices.


Claude Code token limits: What engineering leaders must know about AI coding costs
If you've spent any time on Reddit's AI development forums lately, you've seen the frustration firsthand. Developers hitting their Claude Code limits mid-session, burning through $20 in a day when they expected to spend that much in a month, and waking up early just to reset their 5-hour usage windows before the workday starts.
One developer put it bluntly: "4 hours of usage gone in 3 prompts. Used plan mode to refactor a frontend architecture. Worst part is I just re-subscribed to Claude Code after a few months of Codex usage. Used 11% of my weekly credits." Another observed that switching to Opus 4.5 caused their "current session to burn so quickly" compared to Sonnet.
While some of these issues have been addressed by a price correction and removal of Opus-specific caps, they're symptoms of a broader challenge facing engineering organizations: AI coding tools are becoming essential, but the costs are unpredictable, the limits are opaque, and the connection between usage and actual productivity remains murky.
There is some good news on this front: Token usage data is now available through the Claude Code API. You can track estimated costs, monitor tokens by model, and see usage patterns over time.
But if you're only looking at tokens and dollars, you're missing the point. The real question isn't how much you're spending. It's whether that spend is delivering impact.
How Faros helps organizations optimize AI coding tool spend and impact
Engineering teams are deploying GitHub Copilot, Cursor, Windsurf, Claude Code, and other AI coding assistants under the watchful eyes of executives who expect significant productivity gains. The challenge is that most organizations lack the infrastructure to actually measure whether those gains are materializing.
Faros provides the measurement layer that connects AI tool usage to real engineering outcomes. The platform integrates data from source control, project management, CI/CD pipelines, incident tracking, security scanning, and HR systems to create a unified view of how AI tools are affecting your software delivery lifecycle. Rather than relying on vendor-reported metrics or developer self-assessments, Faros traces the actual downstream impact of AI-generated code on velocity, quality, security, and developer satisfaction.
The AI Transformation solution provides visibility across the full value journey, from initial pilot to large-scale rollout to ongoing optimization. You can track adoption metrics per developer and team, measure acceptance rates and time savings, identify unused licenses and power users, and compare tool effectiveness across different coding assistants. Critically, Faros applies causal analysis to separate AI's true effect from confounding factors like team composition, project complexity, and developer seniority, so you know whether performance changes are genuinely attributable to AI or driven by something else entirely.
For organizations seeking to rapidly assess their AI maturity and plan concrete next steps, the GAINS™ framework measures performance across ten dimensions that define engineering readiness for AI: adoption, usage, change management, velocity, quality, security, cost efficiency, satisfaction, onboarding, and organizational efficiency. Each dimension ties AI usage to business performance, quantifying what's working and where value is being lost.
Faros was recently recognized as the 2025 Microsoft Partner of the Year for Startups for its work helping enterprise software engineering organizations measure AI productivity gains. Companies like Autodesk, Discord, and Vimeo use Faros to become data-driven when it comes to engineering productivity, delivery, outcomes, and AI transformation.
What are Claude Code token limits?
Let's start with the mechanics. At the time of this writing, Claude Code operates on a 5-hour rolling window that begins with your first message in a session. Your token allocation depends on your plan: Pro users get approximately 44,000 tokens per window, Max5 users get around 88,000, and Max20 users receive roughly 220,000 tokens.
These limits reset every 5 hours, but here's where it gets complicated. Starting in August 2025, Anthropic introduced weekly limits on top of the 5-hour windows. This was a response to a small number of users who were, as Anthropic put it, consuming resources at unsustainable rates.
Model selection matters significantly. Opus 4.5 is a premium model with higher per-token costs than Sonnet 4.5 (about 1.7× on list pricing), and Anthropic also gives it much tighter weekly hour caps. Practically, that means heavy use of Opus will exhaust your Pro/Max allocation much faster than Sonnet-only usage. If you're running complex, multi-file agentic workflows with Opus, you'll hit your limits much sooner than you might expect. One developer reported that features like "Explore agents" and "Plan agents" in recent updates were burning through tokens at rates they'd never seen before.
The Claude Code API now provides visibility into several key metrics. You can track estimated cost and tokens used over time, measure total tokens by model, and access usage patterns. For organizations already using Claude Code, you've been able to track active users and sessions, acceptance rates, the number of Claude Code commits and pull requests, and lines of code added and removed.
This is useful data. But it's only the beginning of what you need to measure.
The landscape is shifting faster than you think
Here's something that doesn't get discussed enough: the AI coding tool landscape changes every few months. Models get updated, pricing structures shift, and capabilities expand in ways that can dramatically alter your cost-to-value equation.
Consider what has happened in 2025 alone. Anthropic released Opus 4.5 with significantly different resource consumption patterns. Weekly limits were introduced. Enterprise governance features and a Compliance API rolled out. Each of these changes affected how organizations should think about deployment, cost management, and measurement.
What worked for your team last quarter may not work next quarter. The governance structures and cost controls you set up six months ago probably need revisiting. Complacency is the enemy here. You need continuous monitoring, not a one-time evaluation.
This is true not just for Claude Code, but across the entire AI coding assistant landscape. GitHub Copilot, Cursor, Windsurf, and others are all evolving rapidly. The tool that delivers the best ROI today may not be the same one that delivers the best ROI in six months. Engineering leaders who treat AI tool selection as a set-it-and-forget-it decision are setting themselves up for surprise.
Why token tracking alone won't tell you what you need to know
Now we get to the uncomfortable truth. More code doesn't mean more value. The latest data makes that case harder to ignore than ever.
Faros's AI Engineering Report 2026 analyzed telemetry from 22,000 developers across more than 4,000 teams, tracking metric change between each organization's periods of lowest and highest AI adoption. The throughput gains are real: epics completed per developer are up 66%, and tasks involving code specifically rose 210% at the team level. AI is finally moving organizational roadmaps.
But the downstream picture tells a different story. For every pull request merged, the probability of a production incident has more than tripled. Bugs per developer are up 54%, compared to just 9% in the prior dataset. 31% more PRs are merging with no review at all, not by policy, but because reviewers cannot keep pace with the volume. Median time in PR review is up 441%. The code is getting written faster. The walls are piling up higher, and what is getting through them is causing more damage than before. We call this the Acceleration Whiplash.
The lesson here is clear: if you are only tracking token usage and cost per developer, you are measuring inputs, not outcomes. The output is up. The question is whether it is surviving in production. Those are not the same question, and right now most organizations are only asking the first one.
{{cta}}
What can you measure about your AI coding tools?
If you're already using Claude Code or other AI coding assistants, you should be capturing a comprehensive set of metrics. Here's what visibility looks like when you're doing it right.
Usage Metrics
Track active users and sessions over time to understand adoption patterns. Are developers actually using the tools consistently, or is usage sporadic?
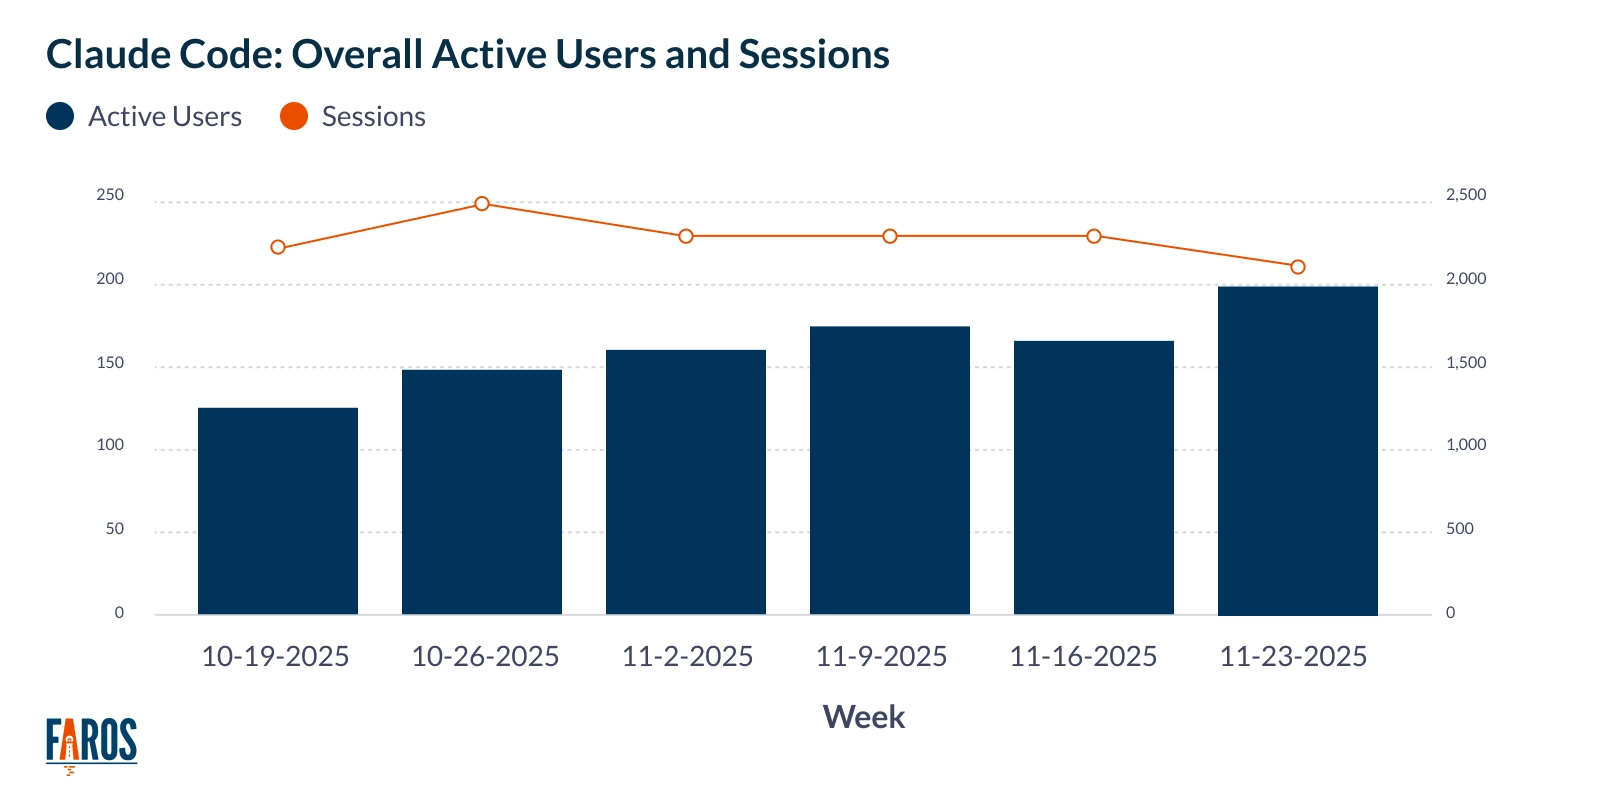
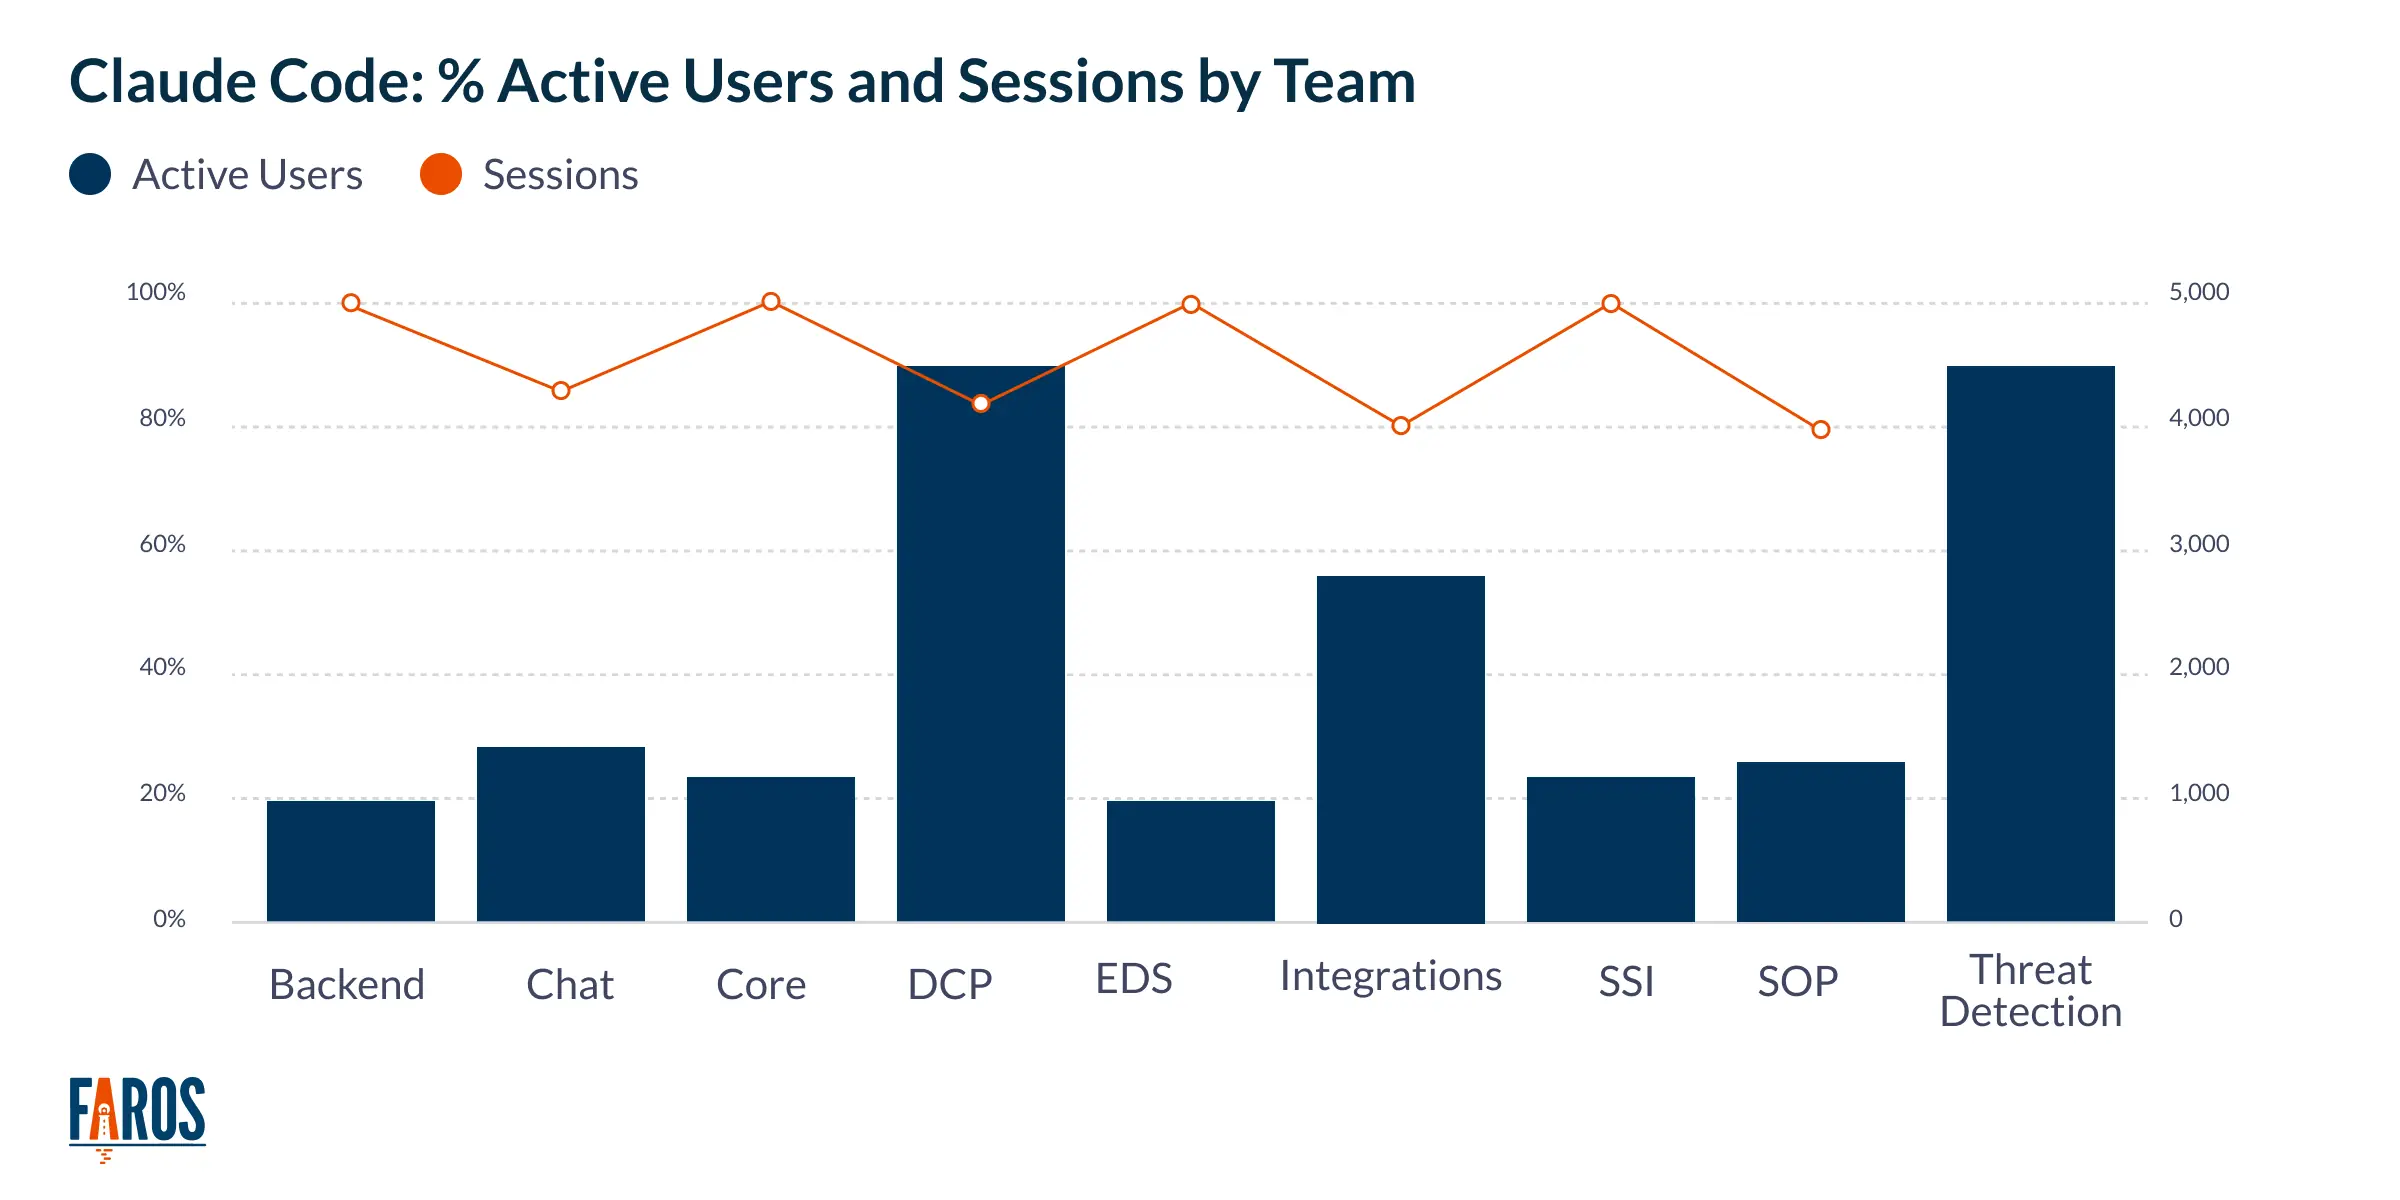
A best practice is to also analyze this data by team to identify which groups are getting the most value and which might need additional enablement or training.
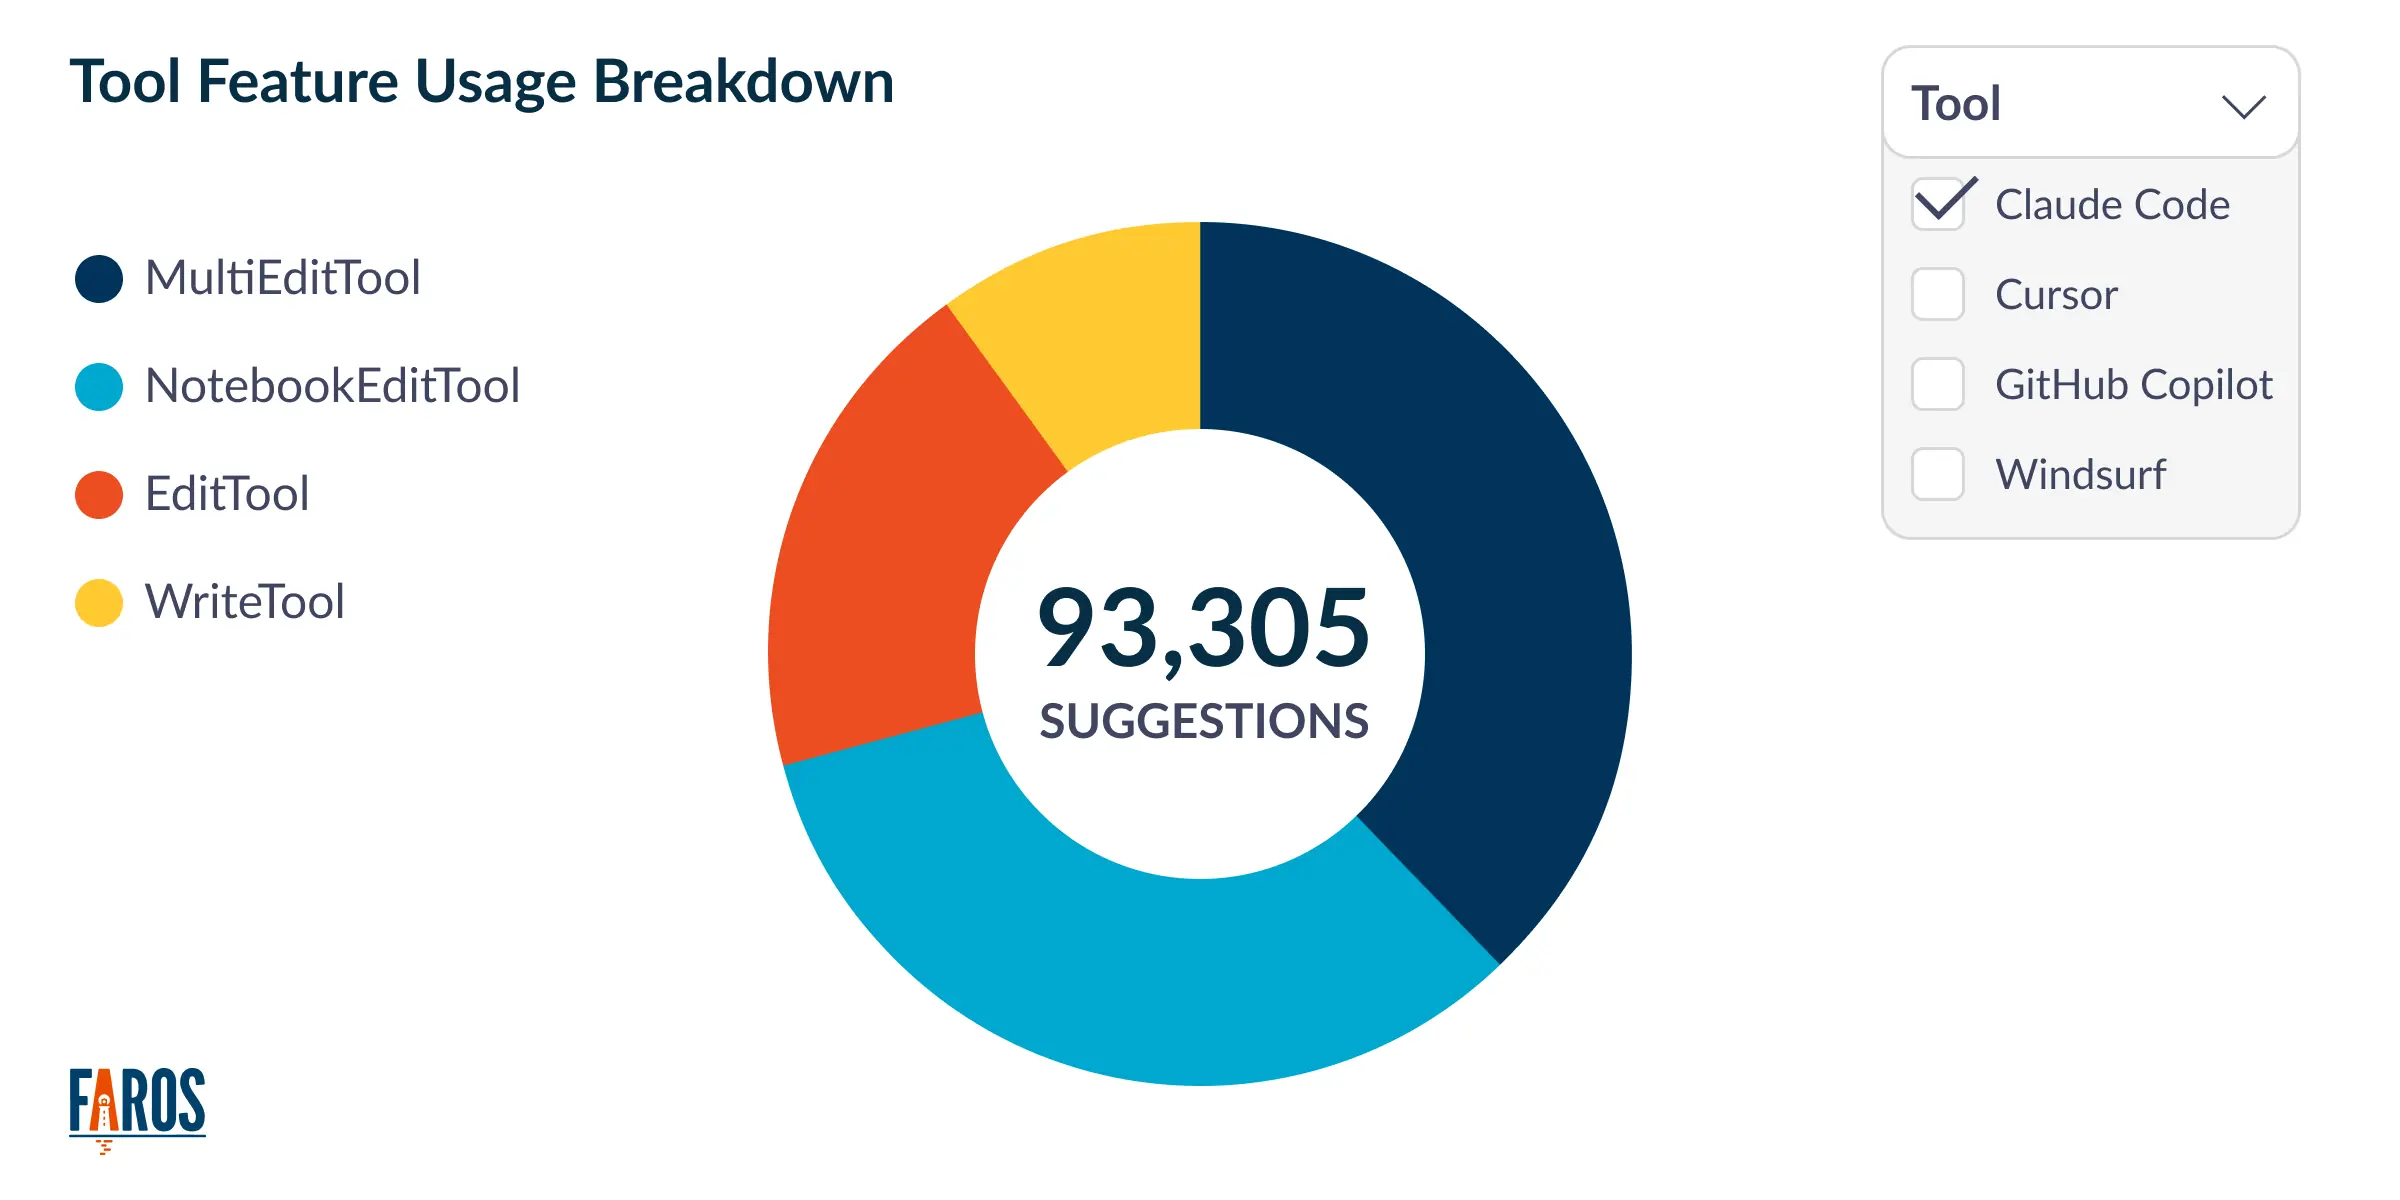
Tool usage breakdown matters too. Claude Code uses different internal tools for different operations, and understanding which tools are being invoked can help you understand how developers are actually working with the AI. Are they primarily using it for multi-file edits, notebook interactions, or straightforward code generation?
Cost Metrics
Total tokens used by model gives you visibility into whether developers are appropriately selecting Sonnet versus Opus for their tasks. If most of your token consumption is going to Opus when Sonnet would suffice, you have an optimization opportunity.
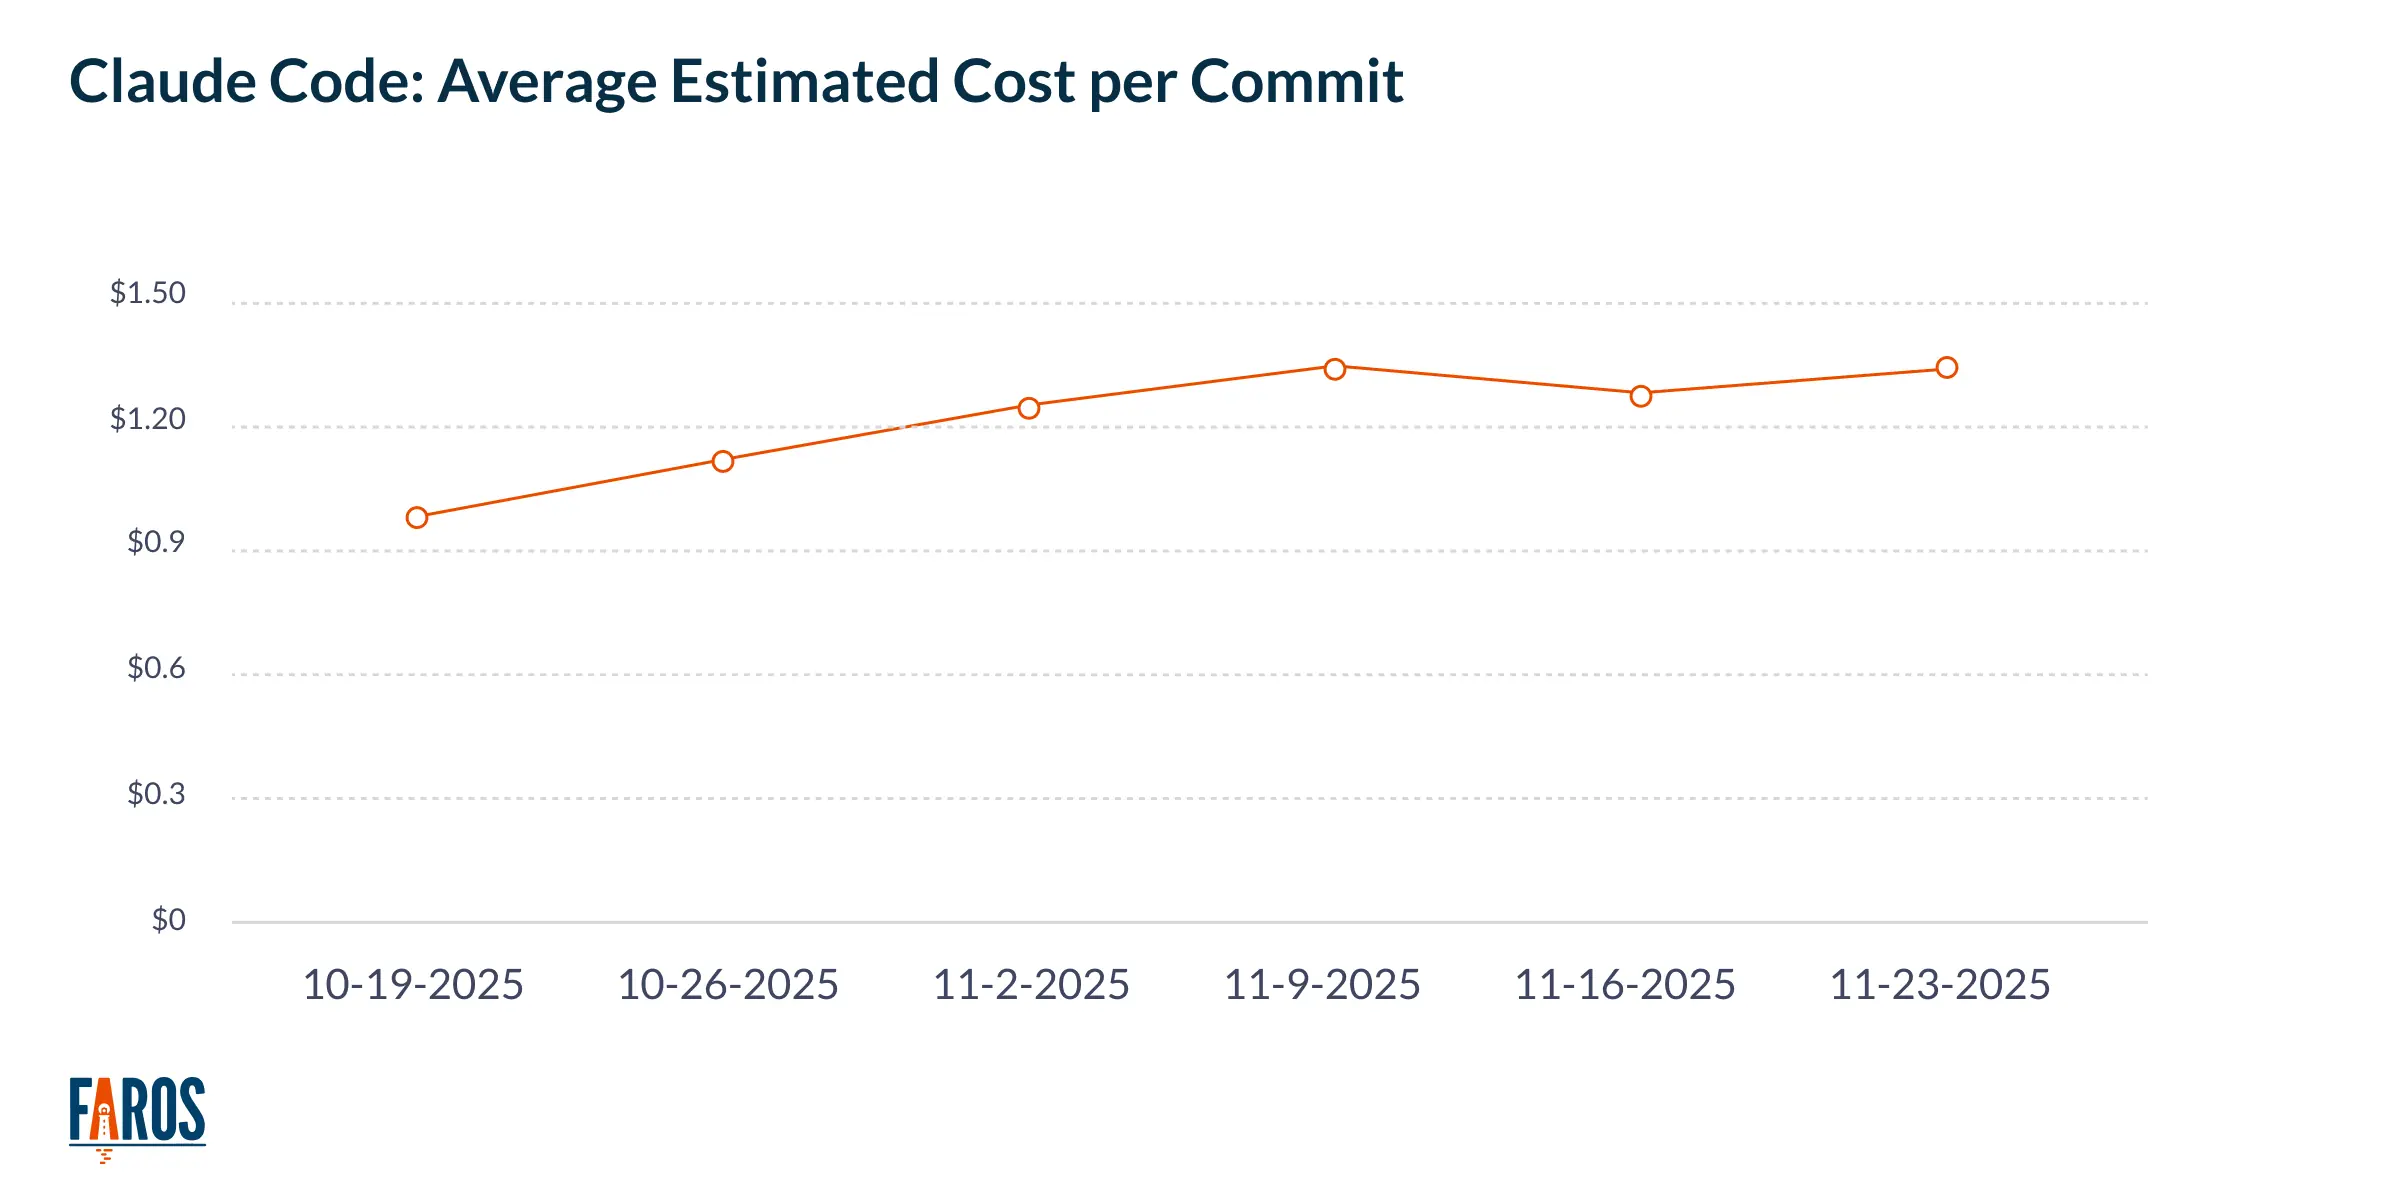
Track estimated cost over time to spot trends and anomalies. Look at average estimated cost per commit to understand efficiency. If cost per commit is trending upward without a corresponding increase in commit complexity or value, something may be wrong with how developers are prompting or configuring their workflows.
Output Metrics
Acceptance rate tells you how often developers are actually using what Claude Code generates. A low acceptance rate might indicate poor prompt quality, misaligned model selection, or tasks that aren't well-suited for AI assistance.
Track the number of commits and pull requests originating from Claude Code sessions. Monitor lines of code added and removed to understand the scope of AI-generated changes. Look at PRs per team and PRs per developer to understand productivity distribution.
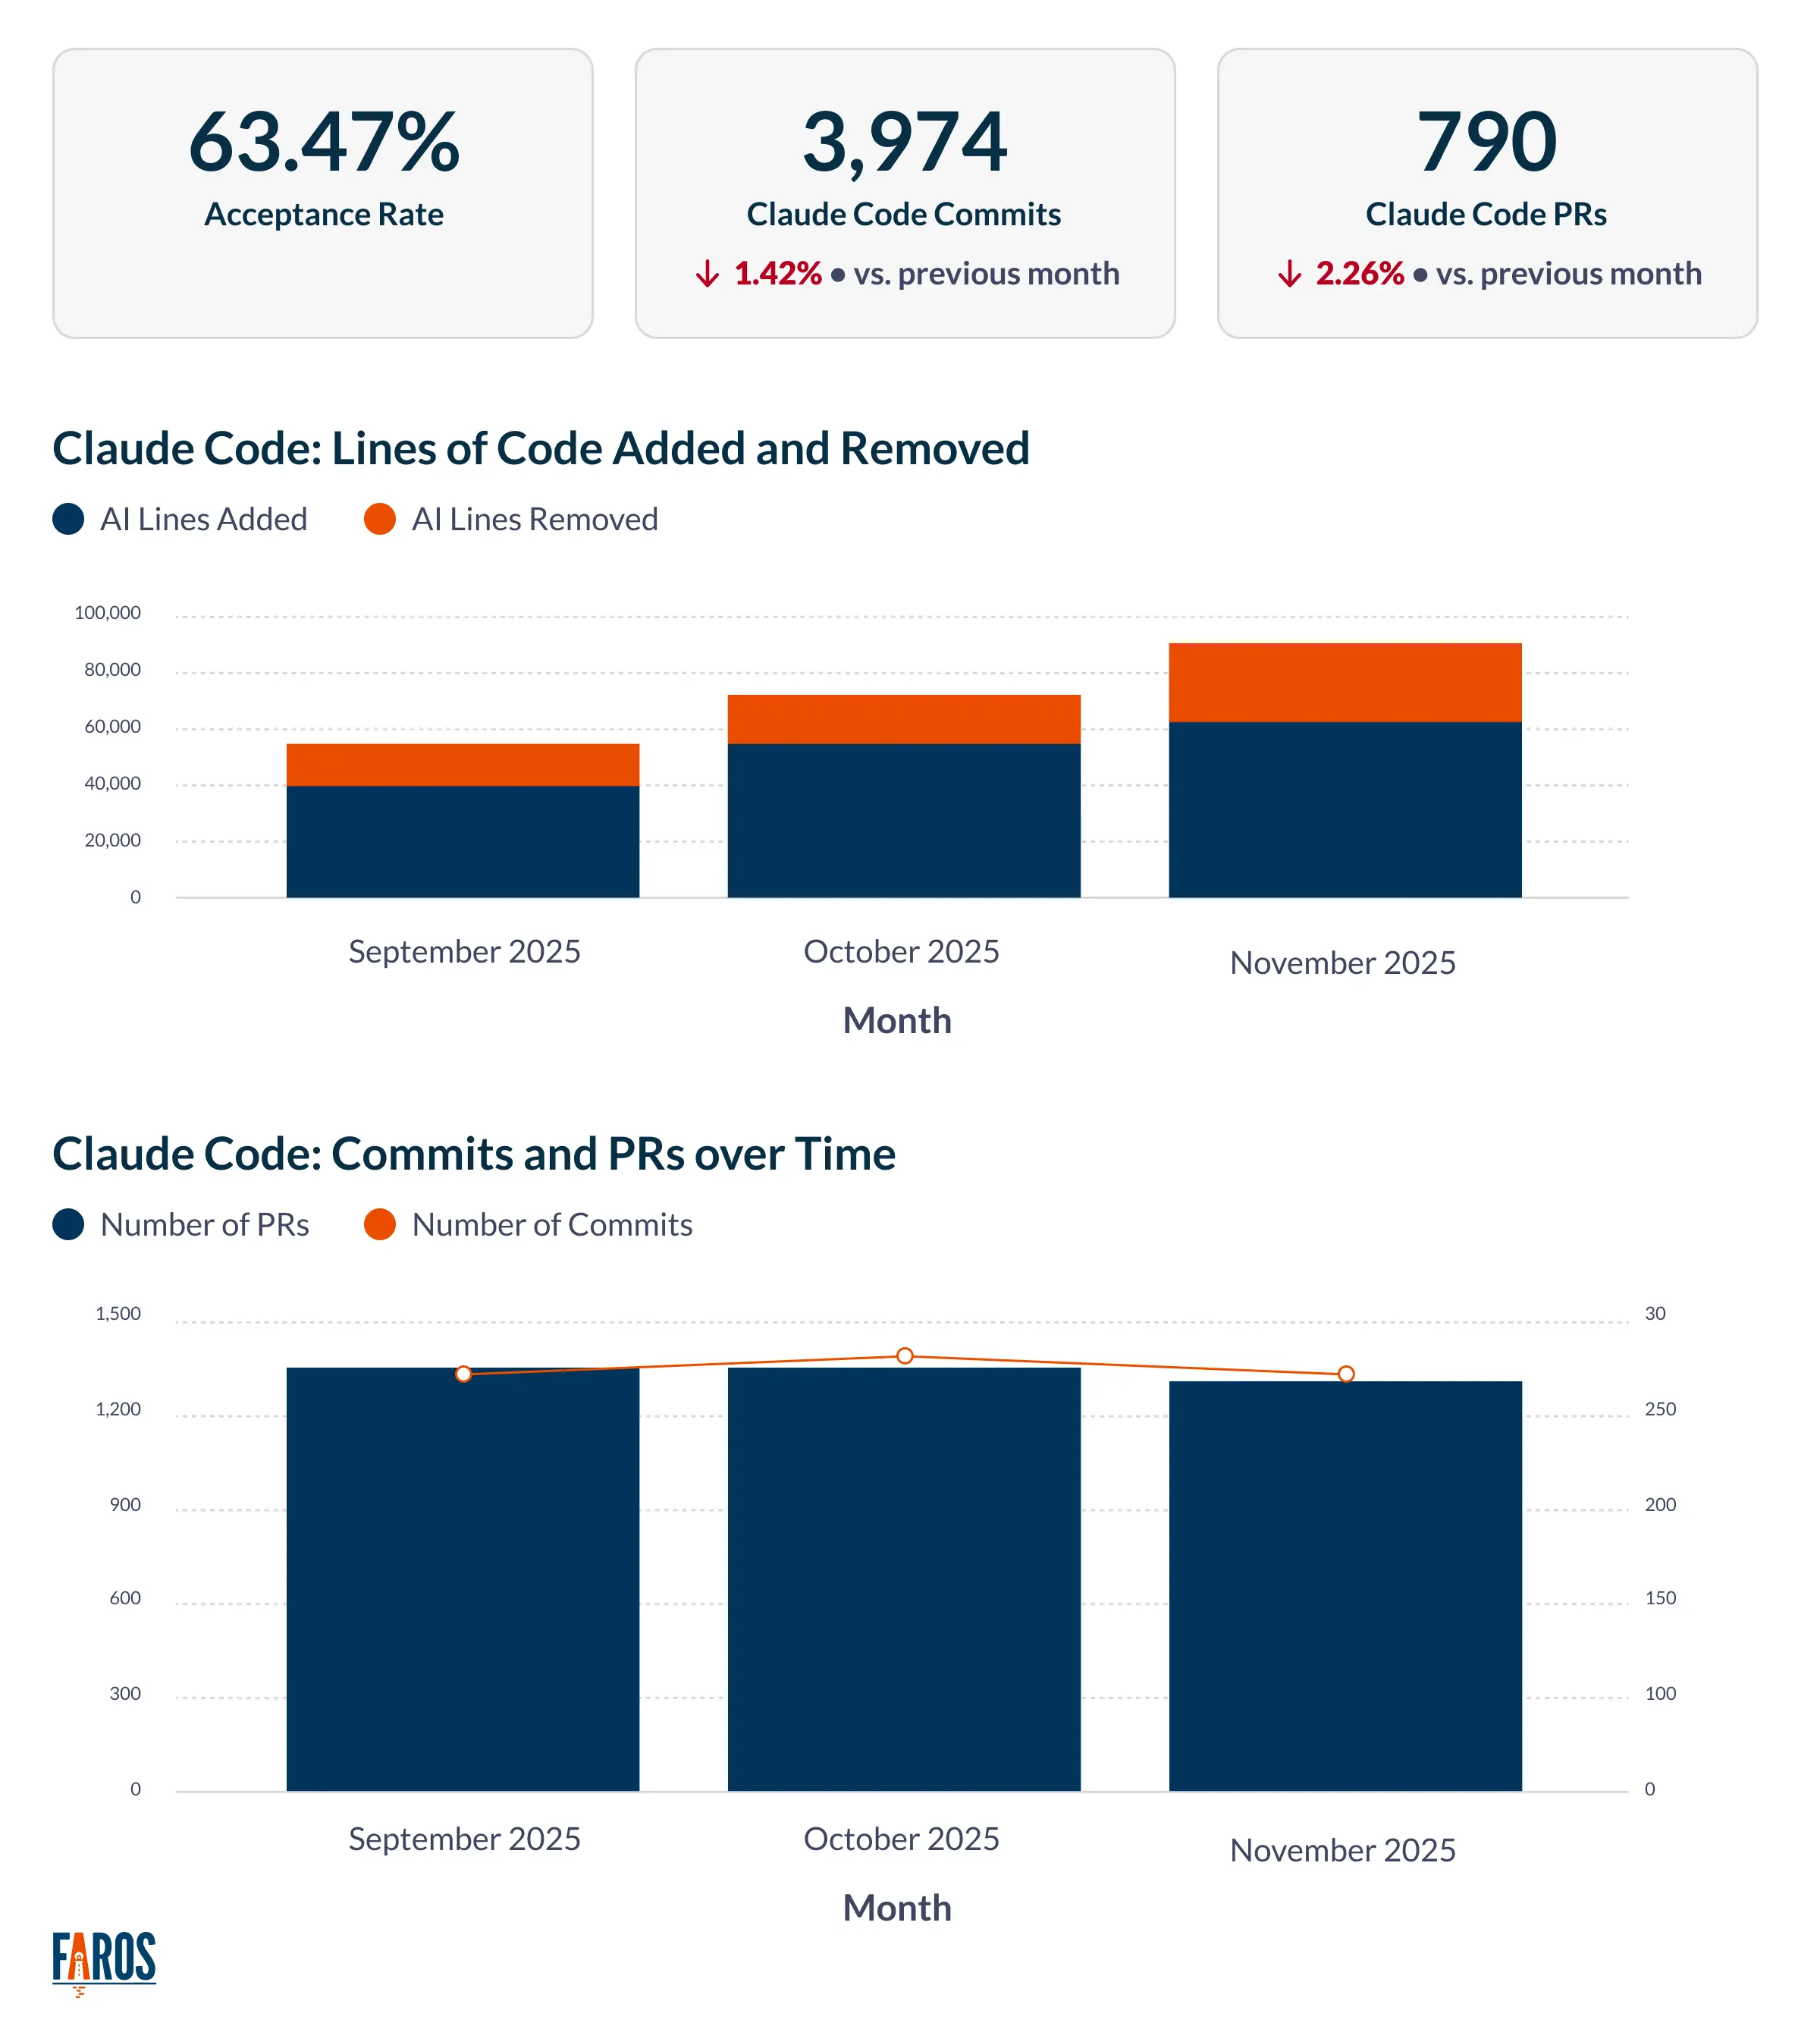
These metrics give you the "what" of AI tool usage. But to understand the "so what," you need to connect them to impact metrics.
What should you actually measure for impact?
To know whether your AI investment is working, you need to track both leading and lagging indicators. Leading indicators tell you if you're on the right track. Lagging indicators tell you if you've arrived.
Leading Indicators
Throughput metrics show you how work is flowing through your system. PR Merge Rate indicates how quickly code is moving from creation to integration. PR Review Time reveals whether AI-generated code is creating bottlenecks for reviewers. PR Size matters because larger PRs are harder to review and more likely to introduce defects, and AI tools have a tendency to generate oversized changes.

Pre-production quality metrics at this stage include code smells detected in AI-generated code and code coverage for AI-assisted changes. If AI-generated code is introducing more code smells or shipping with lower test coverage, you're trading short-term velocity for long-term maintenance burden.
Lagging Indicators
Velocity metrics capture actual delivery outcomes. Task Throughput measures how many units of work are getting done. Lead Time tracks the end-to-end time from work starting to work shipping. Deployment Frequency indicates how often you're actually getting value to production.
Production quality metrics at this stage reveal the downstream consequences of your development practices. Change Failure Rate (CFR) tells you how often deployments cause problems. Mean Time to Recovery (MTTR) shows how quickly you can fix issues when they occur. Bugs per Developer and Incidents per Developer help you understand whether individual productivity gains are coming at the cost of quality. Rework Rate reveals whether AI-generated code is requiring more revision than human-authored code.
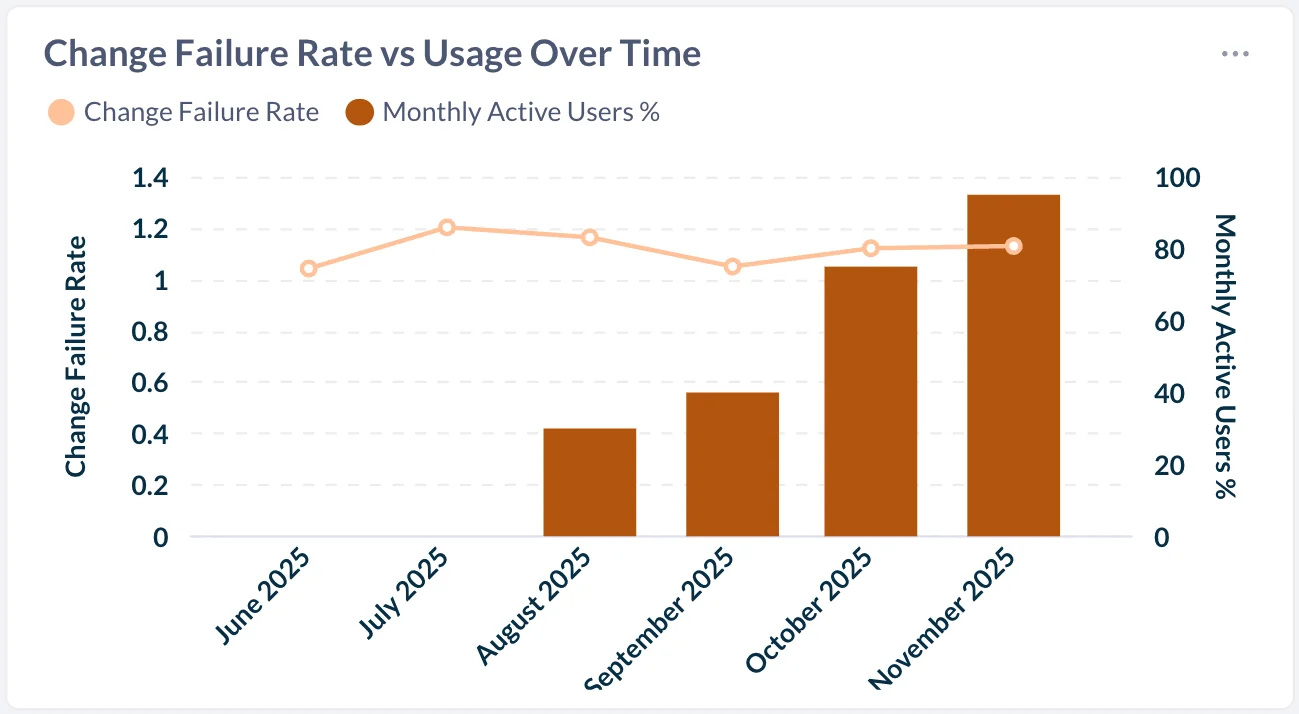
The key is connecting these metrics across the full lifecycle. You want to see whether increases in AI usage and output are translating into improvements in delivery velocity and quality, or whether gains in one area are being offset by degradation in another.
Satisfaction metrics matter alongside telemetry. If developers are reporting that AI tools are frustrating to use, require excessive prompting, or generate code that needs heavy editing, that's signal you can't get from usage data alone.
How do you know if your AI investment is working?
Cost per developer is only part of the equation. The average cost for Claude Code runs around $6 per developer per day, with 90% of users staying below $12. For team deployments using the API, expect roughly $100-200 per developer per month with Sonnet 4.5, though there's significant variance based on usage intensity and whether developers are running multiple instances.
But here's the real question: is that spend worth it?
To answer that, you need to compare tool effectiveness across your portfolio. If you're using GitHub Copilot for some teams, Cursor for others, and Claude Code for others still, you need a unified view of how each tool is performing relative to cost.
A/B testing and cohort analysis help you isolate the impact of specific tools. One data protection company ran a bake-off between GitHub Copilot and Amazon Q Developer, measuring adoption, usage, and downstream productivity impacts. They found 2x higher adoption and user acceptance with their chosen tool, 3 additional hours saved per developer per week, and 40% higher ROI compared to the alternative. That kind of rigorous comparison is what separates organizations that are genuinely optimizing from those that are just guessing.
Connect usage to business outcomes wherever possible. An software company with 300 engineers used comprehensive AI coding assistant measurement to track not just adoption and productivity metrics, but downstream impacts on PR cycle times. The result was $8M in savings from productivity improvements, and leadership gained the ability to course-correct faster when adoption patterns weren't delivering expected results.
The right tool and model are worth paying more for, but only if they deliver impact. Opus 4.5 costs more than Sonnet. Claude Code may cost more than alternatives. That's fine if the incremental spend generates incremental value. But you can't know that without measuring both sides of the equation.
What should engineering leaders do with this data?
Here are five things engineering leaders should do with Claude Code token limit, usage, and impact data:
- Build a unified view across all AI coding tools. If your developers are using multiple assistants, or if different teams are using different tools, you need a single pane of glass that shows usage, cost, and impact metrics across all of them. Fragmented visibility leads to fragmented decision-making.
- Set governance guardrails before costs spiral. Anthropic's enterprise features now include granular spend controls at the organization and individual user level, managed policy settings for tool permissions and file access, and usage analytics built into the platform. Use these controls proactively, not reactively.
- Continuously monitor leading and lagging indicators. Don't wait for quarterly reviews to discover that AI-generated code is creating review bottlenecks or introducing quality issues. Build dashboards that surface these signals in near real-time, and establish alerting for metrics that move outside expected ranges.
- Make model and tool decisions based on impact, not just price. The cheapest option isn't always the best value. The most expensive option isn't always the highest quality. You need data to make informed decisions, and that data needs to span the full lifecycle from usage through delivery outcomes.
- Revisit your strategy as models and tools evolve. What's true today may not be true in six months. Build review cycles into your AI tooling strategy, and be willing to adjust your approach as the landscape changes.
Conclusion
Claude Code token limits are real constraints that engineering organizations need to understand and manage. But focusing solely on tokens and costs misses the bigger picture.
The developers frustrated about burning through their usage allocation are not wrong. But the more important question is not how much AI is consuming. It is what AI is producing, and whether that production is holding up where it matters most: in code review, in deployment, and in production systems that real users depend on.
The Acceleration Whiplash is real. Throughput is up, and those gains are genuine. But for every code change merged, the probability of a production incident has more than tripled. Bugs are accelerating, not stabilizing. 31% more code is reaching production with no human review. And the engineering systems built around human-paced development and human-quality code were not designed to absorb what AI is now producing at scale.
{{cta}}
The organizations that will get the most from AI coding tools are those that measure usage, cost, and impact together, across the full software delivery lifecycle. They track leading indicators like PR merge rate, review time, and context switching. They monitor lagging indicators like lead time, deployment frequency, change failure rate, and incident rate per PR. They connect what developers are doing with AI to what is actually reaching production, and what is surviving there. And when the numbers diverge, they have the granularity to understand why, not just that something went wrong.
A good tool and a good model are worth paying more for, if they deliver impact. But you cannot know if they are delivering impact unless you are measuring the right things. Right now, most organizations are not.
Ready to see how your AI coding tools are actually performing? Request a demo of Faros to get unified visibility into usage, cost, and productivity impact across your entire AI coding assistant portfolio.
Read the report to uncover what’s holding teams back—and how to fix it fast.
What to measure and why it matters.
And the 5 critical practices that turn data into impact.


- Engineering throughput is up
- Bugs, incidents, and rework are rising faster
- Two years of data from 22,000 developers across 4,000 teams

Ten takeaways from the AI Engineering Report 2026: The Acceleration Whiplash
What two years of telemetry data from 22,000 developers reveals about AI's real impact on developer productivity, code quality, and business risk in 2026.

