
TL;DR: Claude Code's built-in commands like /usage and /status for subscription users and /cost for API users give you the baseline you need to track Claude Code token usage. Community tools like ccusage and Claude-Code-Usage-Monitor fill the historical and real-time gaps. Behavioral changes, like clearing context between tasks, scoping requests before sending, and routing subagent work to lighter models produce the most durable reductions to Claude Code token usage.
For AI engineering leaders, the central pain points associated with Claude Code token usage are proving AI impact and managing AI costs. Both require connecting token spend to delivery outcomes, not just watching the meter.
Tracking Claude Code token usage in software engineering
Claude Code launched just over a year ago. Since then, Anthropic has shipped new models, restructured pricing, changed plan limits twice, and introduced multi-agent capabilities that can multiply token consumption in ways developers don't see coming. The result: engineers are hitting limits mid-session, finance teams are asking questions nobody has answers to, and the billing math has gotten harder to track.
This article covers how to check your Claude Code token usage, how to monitor it in real time, what actually drives consumption up, and how to reduce it in ways that keep work moving. The final section covers what token usage data alone can't tell you, and what you need to pair it with to understand whether that spend is producing anything.
What are token limits in Claude Code?
Before you check anything, it helps to understand what you're checking against. Claude Code’s token limit structure has changed enough in 2026 that documentation from six months ago is often wrong.
As of June 2026, Claude Code enforces two overlapping limits. The five-hour rolling window caps how much you can consume in a short burst. The weekly cap governs sustained use over time. Both limits are shared across Claude Code, Claude.ai chat, and Cowork. Burn tokens in one and you lose capacity in the others within the same window.
Plan tiers are now defined by multiplier rather than fixed token counts. Anthropic no longer publishes specific token numbers for each plan. Pro is the baseline, Max 5x gives you five times that, and Max 20x gives you twenty times. Actual limits vary by model and usage pattern.
One thing that catches software engineering teams off guard: model releases change your effective consumption without changing the rate card. For example, the tokenizer introduced with Opus 4.7 generates roughly 30– 35% more tokens than previous models for the same text. A workflow that fit comfortably within your plan limits last quarter may push against them now, without any change in how you're working. If you've recently upgraded models and your limits feel tighter, that's why.
For the most up to date information, check the Faros Claude Code token limits blog for a current account of how limits have shifted and what each plan tier covers in practice.
How to check your Claude Code token usage
The answer depends on how you're accessing Claude Code, because subscription users (Pro, Max, Team) and API users see different data. Subscription users should check /usage and /status, while API users should check /cost.
For subscription users: /usage
Type /usage in any Claude Code session. You'll see:
- Plan usage bars showing how much of your five-hour window and weekly limit you've consumed
- A breakdown of what's counting against your limits, attributed to skills, subagents, plugins, and individual MCP servers, each shown as a percentage of the total
- Session token counts and a locally estimated dollar figure for reference
That dollar figure is a local estimate computed from a price table bundled at build time. It's useful for development insight but isn't authoritative billing data. For actual billing, check the Usage page in the Anthropic Console.
Use /status for a quick check before starting a heavy session. It shows remaining allowance and the exact time until your five-hour window resets, which is more useful than /usage when you just need to know if you have room.
For API users: /cost
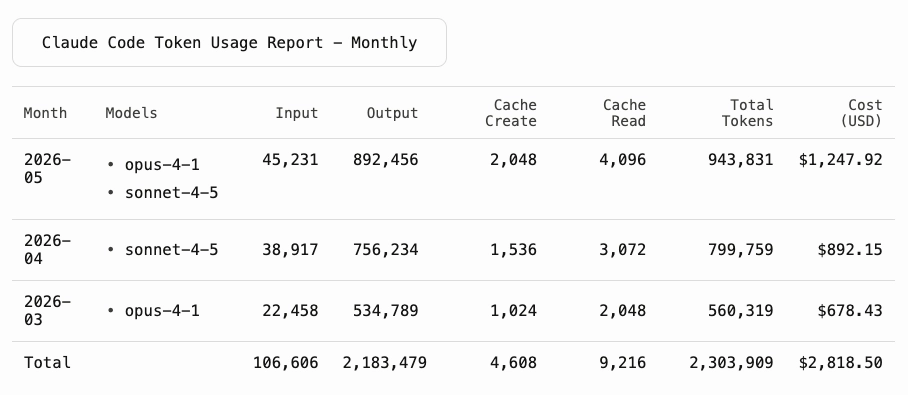
If you're accessing Claude Code via API key (pay-as-you-go), /cost shows the full session cost breakdown: cumulative spend, time consumed, lines of code added and removed, and token usage by model broken down into input, output, cache reads, and cache writes. This command is hidden by default for subscription users since they're not billed per call.
How to check Claude Code token usage across sessions
The built-in commands cover the current session. For historical usage across multiple sessions and projects, you need a community tool. The /usage command shows your current session; it doesn't cover trends over time.
How to monitor Claude Code token usage in real time and over time
Two community tools (ccusage and Claude-Code-Usage-Monitor) cover what the built-in commands don't—historical trends, live burn-rate monitoring, and persistent visibility—without interrupting your workflow.
ccusage: historical session analysis
ccusage (16,500 GitHub stars, actively maintained) parses your local Claude Code session logs without sending data anywhere. Run it with npx ccusage@latest — no installation required. You can filter by date range, project, and model, and export results to JSON for further processing.
One caveat worth knowing is that Claude Code retains local session logs for only 30 days by default. If you want to analyze usage beyond that window, change cleanupPeriodDays in your Claude Code settings before you need the data, not after.
ccusage is the right tool for weekly trend analysis like spotting which projects are consuming the most, whether cache hit rates are healthy, and whether cost per session is trending in the right direction.
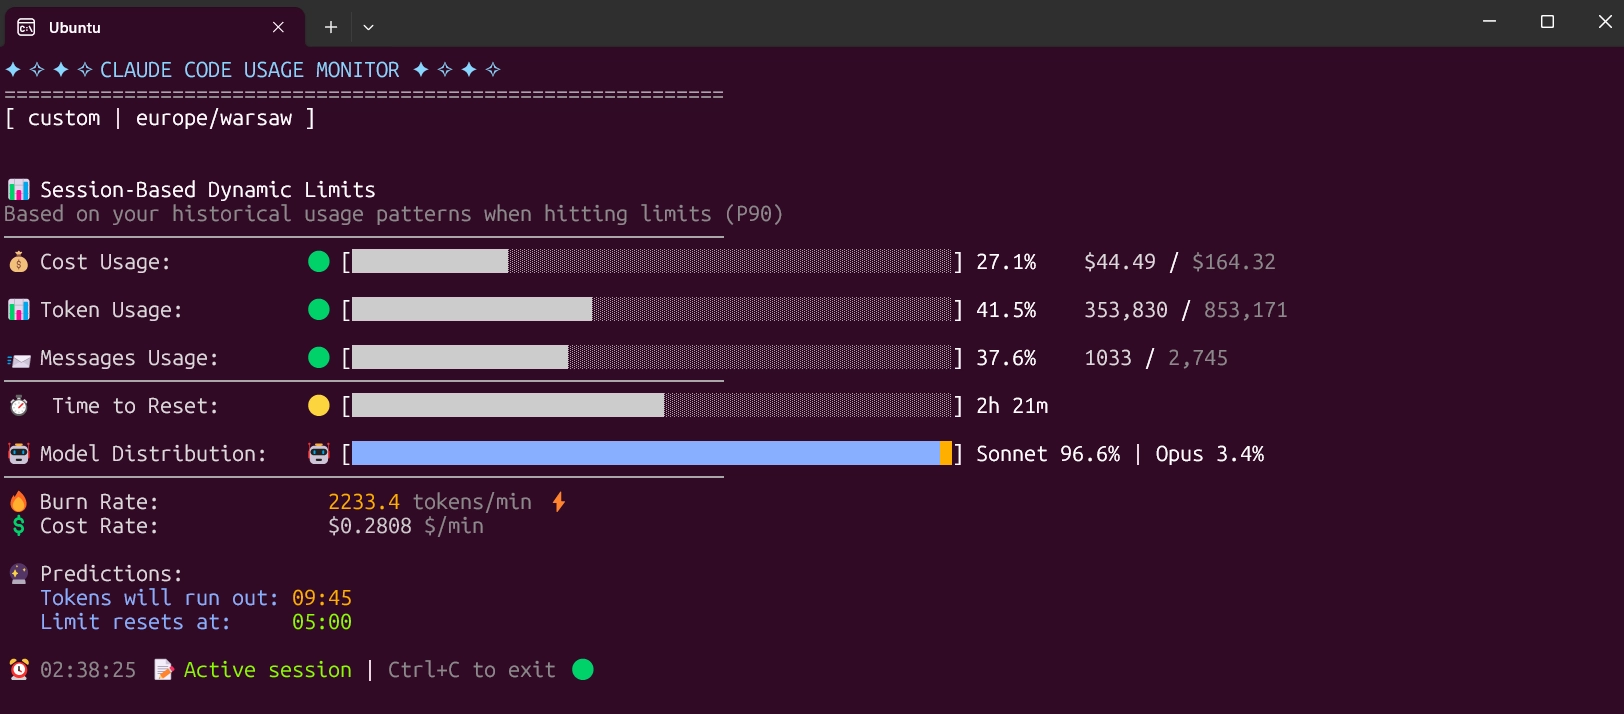
Claude-Code-Usage-Monitor: live burn-rate tracking
Claude-Code-Usage-Monitor (8,300 GitHub stars) is a real-time terminal dashboard with burn-rate predictions and time-to-limit projections. It supports Pro, Max 5x, and Max 20x plans and includes a custom mode that auto-detects your limits from recent session history.
Keep it open in a side pane during any session involving subagents or long agentic runs. The value is early warning: seeing that you're 70% through your five-hour window with 40 minutes of work remaining is useful. Finding out you hit the wall mid-task is not.
Recommended monitoring stack
- /usage or /status for in-session spot checks
- ccusage weekly for cost attribution by project
- Claude-Code-Usage-Monitor during heavy agentic sessions or any workflow involving subagents
What increases Claude Code token usage?
Understanding where tokens go is the first step toward controlling them. Five sources account for most surprise spend: tool output bloat, vague prompts and rework loops, subagents, Agent Teams, and extended thinking mode.
Tool output bloat
A single grep with 50 matches can consume 10,000 to 15,000 tokens. File reads, directory listings, traversals, and test output accumulate across a session, and Claude Code resends the full accumulated context on every turn. This is often the largest token consumer in a session, ahead of both prompts and responses.
Verbose tool outputs are noise at the model level. A log file with 10,000 lines, a grep returning every match, a directory listing of a large monorepo—none of this requires the full content. The useful signal is usually a small fraction of the total.
Vague prompts and rework loops
Claude Code's query loop resends the entire message history, system prompt, and tool schemas on every retry. On a long session with several retries, a poorly scoped prompt can consume 50,000–300,000 tokens before producing anything useful.
The same work that generates a rework loop on a vague prompt typically completes in far fewer total tokens when the task has a clear scope and a defined output. "Refactor this module" triggers exploration. "Extract the authentication logic from auth.ts into a separate service, preserving the existing function signatures" gives Claude Code enough context to act without wandering.
Subagents
Subagents are the standard multi-agent path in Claude Code, available to all users. They're also the most common source of unexpected token spend.
Each subagent runs its own API calls in a fresh context window. The orchestrator accumulates all returned results in its own context. Three subagents on one task is roughly four times the token spend of a single-thread session. Subagent-heavy workflows add 200–500% overhead compared to single-agent approaches.
There's a compounding risk: Claude, particularly on Opus, has a documented tendency to over-delegate, spawning subagents for work the main session could have handled directly. A prompt like "do a deep security review of this codebase, you may need multiple subagents" can exhaust 50% of a Max 5x weekly limit in under a minute.
The /usage breakdown showing subagent percentage is the most useful diagnostic here. If subagents are consuming 80 percent of a session that produced one PR, that's the signal to adjust.
Agent Teams (experimental, opt-in)
Agent Teams are a separate and newer pattern, available since February 2026 but disabled by default. Enabling them requires explicitly setting CLAUDE_CODE_EXPERIMENTAL_AGENT_TEAMS in your environment. Unlike subagents, which report back to a single orchestrator, Agent Teams run multiple full Claude Code instances that communicate peer-to-peer through a shared task list.
Token costs scale linearly per active teammate — roughly three to four times a single session for a typical three to four teammate configuration. For large parallel pipelines where the orchestrator-accumulation problem with subagents would otherwise dominate, Agent Teams can actually be more token-efficient. For routine tasks, they're not worth the overhead.
If you're not intentionally running Agent Teams, you're not running them. This is the one multi-agent pattern that requires deliberate setup.
Extended thinking mode (model default)
Extended thinking is enabled by default in Claude Code because it improves performance on complex tasks. Thinking tokens are billed at output token rates, which is five times input pricing. For routine tasks that don't require deep reasoning, this is unnecessary spend. Use /effort to lower the thinking budget, or disable it in /config for task classes where it isn't needed.
How to reduce Claude Code token usage without reducing output
The effective reductions come from a small number of high-leverage changes.
Clear context between tasks. Use /clear when switching to unrelated work. Stale context from a previous task gets resent on every subsequent message. Clearing between tasks cuts per-message token cost by 30–50%. Use /rename before clearing so you can find the session later with /resume.
Keep CLAUDE.md concise. CLAUDE.md injects into every request. A 5,000-token CLAUDE.md is a 5,000-token tax on every turn, for every session, for every developer on the team. Document decisions and conventions. Remove aspirations, context Claude can infer, and anything that's no longer current.
Scope tasks before sending. Break large requests into smaller pieces with a defined output. "Implement the full payment flow" will explore widely. "Add Stripe webhook handling to the existing payment controller, matching the pattern in the Braintree handler" will act directly.
Route subagent work to lighter models. This is the largest single cost lever for anyone using multi-agent workflows. Set model: haiku in subagent configuration for worker agents. Haiku costs five times less than Opus. The planner can stay on Opus; the workers doing file reads and grep calls don't need it. Check the CLAUDE_CODE_SUBAGENT_MODEL environment variable — if it's set in your shell or dotfiles, it overrides your configuration silently.
Let prompt caching work. Claude Code handles prompt caching automatically for repeated inputs like system prompts and CLAUDE.md content. Cache reads cost approximately 10% of standard input pricing. A high cache read percentage in your /usage output means caching is working well. A low percentage usually means dynamic content is appearing in the system prompt and invalidating the cache on every request.
AI usage, impact, and cost management across multiple AI coding tools
The monitoring techniques and tools covered above work well for individual developers tracking their own Claude Code usage. At the team and organization level, the picture gets more complicated.
Engineering organizations rarely standardize on a single AI coding tool. A common scenario: one team runs Claude Code, another uses Cursor, a third is piloting Codex. Each tool has its own usage data, its own API, and its own reporting format. There's no built-in way to compare them, and there's no shared view of what each team is spending or producing. Organizations looking for AI usage and impact tracking, as well as AI token cost management, often turn to more specialized solutions provided by software engineering intelligence platforms (SEIPs) like Faros.
AI Usage and Impact Tracking
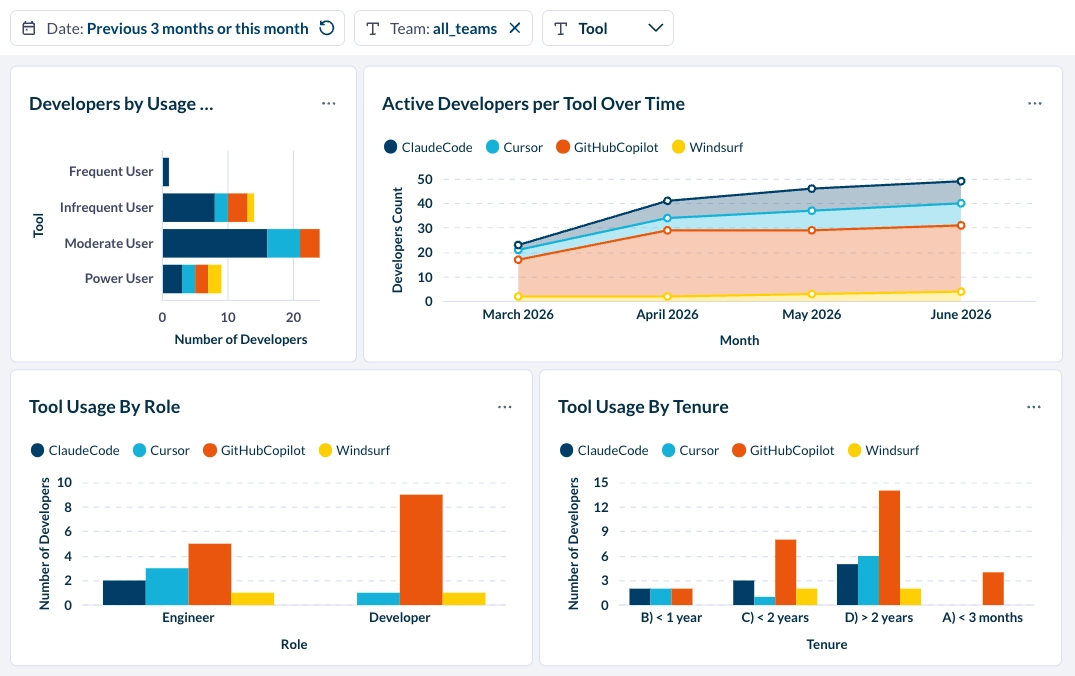
Rather than reading from a single tool's API, Faros's AI impact analysis capabilities ingest AI usage data from across all your tools—Claude Code, Copilot, Cursor, Windsurf, Codex—and make it available in a unified view. Attribution is the key capability: usage is tied to teams, not just aggregated at the org level, so you can see which team is spending what, on which tool, and with which model.
The most important capability is connecting that AI usage to delivery outcomes. Token spend and acceptance rates tell you about activity. What engineering leaders actually need to know is whether that activity is moving work forward. That requires correlating AI usage data with the engineering signals that sit in your source control, work management, CI/CD pipeline, and incident tracking systems.
Leading indicators like PR merge rate, PR review time, and PR size show whether AI-assisted changes are moving through the pipeline smoothly or creating friction. Lagging indicators like feature completion rate, change failure rate, incident rates, and mean time to recovery show whether what shipped held up. Solutions like Faros use causal analysis to isolate AI's contribution to those metrics, by team, by tool, and by workflow, rather than relying on surface-level correlations.
For engineering organizations using multiple AI tools, this also enables structured comparison: before/after analysis when a tool is introduced, or side-by-side A/B evaluation between teams using different tools. That's the evidence base for tool selection decisions at scale.
AI token cost management with Token Intelligence
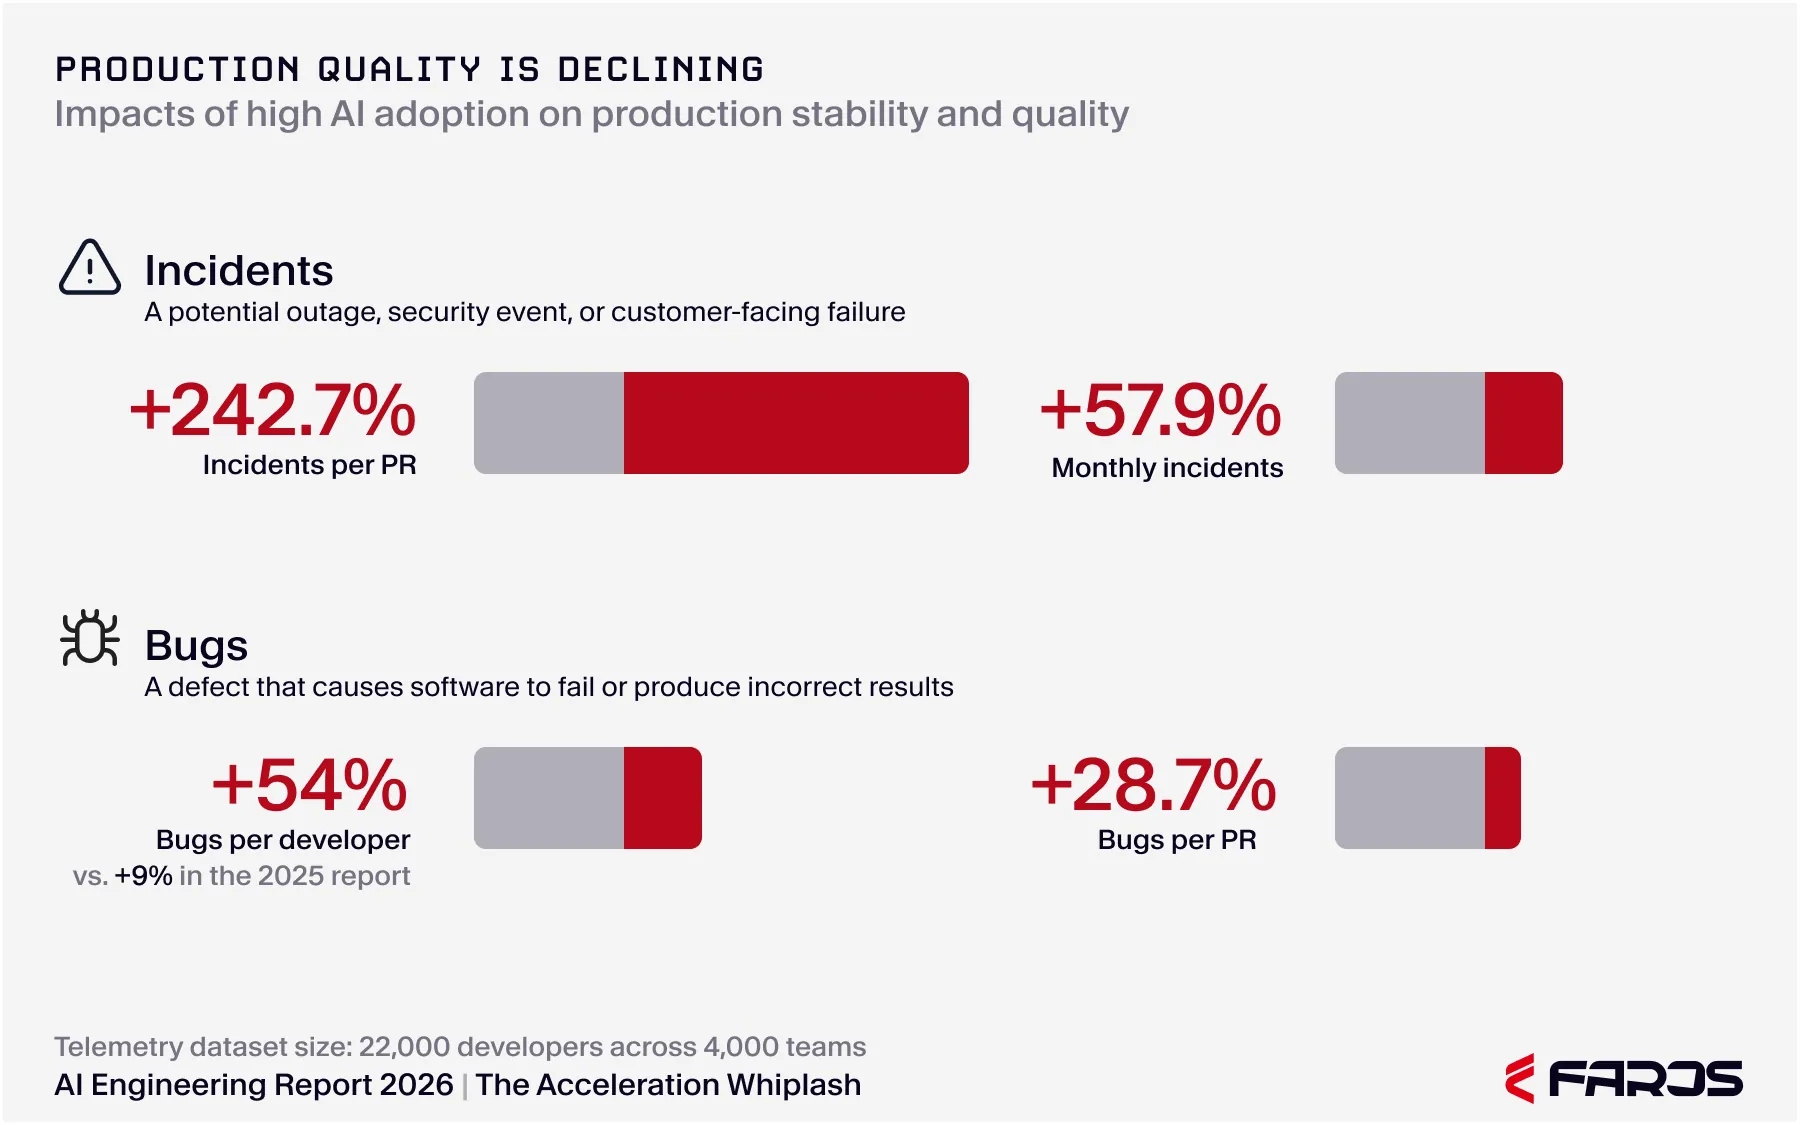
Getting token visibility under control is step one. The harder task is determining whether that spend produced anything valuable. The reason this is challenging to answer is because token data tell you about consumption, but it doesn’t tell you whether a session produced a PR that merged, a ticket that closed, or a deployment that held. Cost per session and cost per commit are available from Claude Code's own data. Whether those commits led to incidents, whether review time is increasing, whether AI-assisted changes are carrying more bugs than human-written ones—that requires connecting usage data to delivery metrics that live outside Claude Code.
The AI Engineering Report 2026 found a 441% increase in median PR review time, a 3x rise in incidents per PR, and 31% of PRs reaching production with no review across 4,000 teams. None of those signals appear in token dashboards.
Faros’s Token Intelligence solution is the layer that closes this gap. It traces total AI spend across teams, tools, models, and work types, classifying each token as productive, inefficient, or wasteful. Spend is mapped to each team and surfaced with verdicts for every tool in the stack based on cost per output. This gives engineering leaders the data to decide which tools to keep, scope, or cut based on what they actually produced.
.webp)
The Field Guide to Measuring Token Efficiency in AI Engineering covers the metrics worth tracking to connect AI spend to outcomes in your own data.
Go from token tracking to outcome maxxing with Faros
Faros is the system for running engineering with AI. We give engineering leaders visibility into how work operates across code, people, and systems, plus control over how that work progresses through enforceable workflows and policy. This enables organizations to deploy AI effectively and improve engineering throughput with stronger cost efficiency. Request a demo to see what Faros can do for you.