
Developer Productivity
Improve EngineeringEfficiencyat scale
Identify and remove friction from developer
workflows so you can ship better code, faster.
Balance speed with quality for the ultimate developer experience
Reveal your bottlenecks
Diagnose and resolve blockers in tools, infrastructure, and collaboration to increase velocity.
Elevate code quality
Monitor code coverage, test flakiness, change failure rate, and MTTR to improve customer satisfaction.
Create seamless workflows
Understand developer pain points, corroborate with telemetry, and eliminate friction to avoid burnout.

Measure what matters with leading frameworks
Gain deep visibility into engineering efficiency and outcomes with holistic metrics from the leading developer productivity frameworks.
- Connect your entire engineering and delivery stack
- Unlock insights in minutes with prebuilt dashboards for SPACE, DORA, DevEx, and more
- Tailor your metrics as needed to align with your goals, operating model, and culture
Paint a holistic picture of the developer experience
Corroborate team sentiment with engineering data and discover how to remove friction from daily collaboration and execution.
- Pre-built survey templates and survey administration
- Triangulated analysis of survey responses with evidence from corresponding metrics
- Auto-generated summaries, insights, and recommendations


Know where you stand—and what to do next
Reduce lead times and increase throughput by baselining performance and identifying high-impact improvements.
- Benchmark performance to identify gaps and drive focus
- Spot issues fast with scorecards and heatmaps
- Pinpoint root cause with expertly trained AI
Introduce best practices with workflow automation
Leverage prebuilt or custom automations for notifications, reminders, and alerts that keep work moving and performance healthy.
- Get daily, weekly, or monthly performance updates
- Send reminders for overdue code reviews or security vulnerabilities
- Alert managers on declining developer focus time

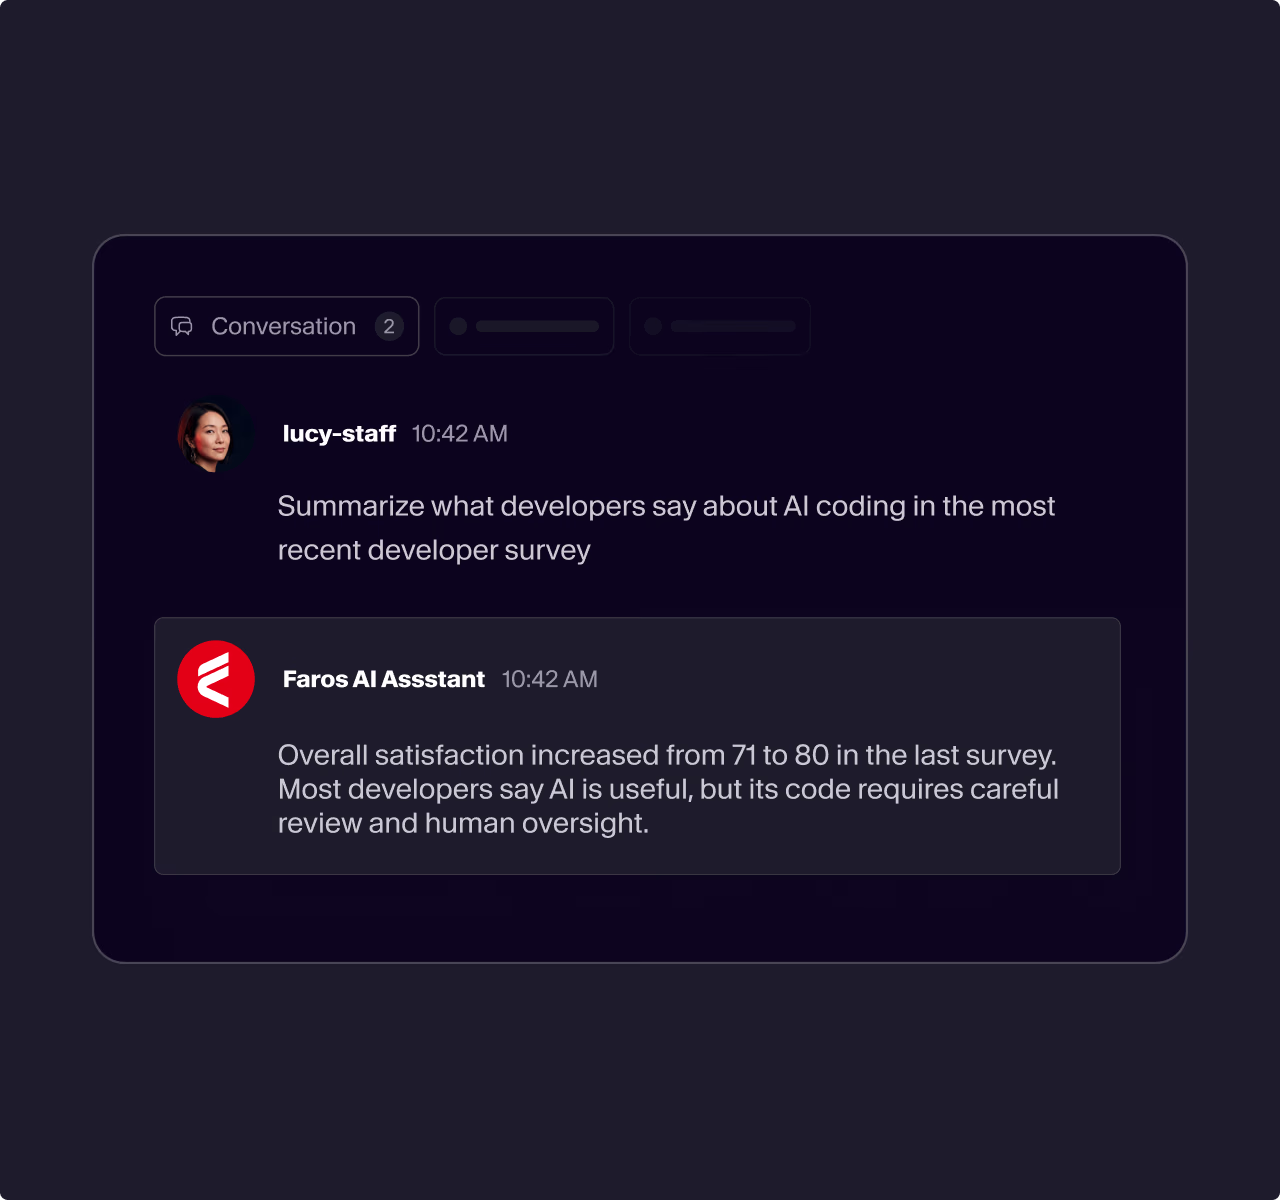
Get instant answers. Just ask Faros.
Your data is at your fingertips wherever you work. Chat with Faros anywhere—in Slack, Teams, or where you code.
- For developers: PR, task, and repo answers directly in the IDE
- For managers: Team health, delivery updates, and new blockers
- For leaders: Progress to goals, major initiatives, and technology updates
“It’s a great thing to be able to track our metrics and take action to help the team be more successful. Teams are no longer left to solve problems in isolation.”

We’ve got you covered.
Here are a few highlights.
These are some of the main areas and popular metrics we cover. There's lots more to discover.
Velocity
- Lead time and throughput
- Cycle times and their breakdown
- Review speed, load, and patterns
- Cross-geo, cross-team dependencies
Quality
- Code coverage, test coverage, code smells
- Test flakiness
- Change failure rate (CFR)
- Mean time to resolve (MTTR or FDRT)
Releases
- Build volumes, speed, and distribution across pipelines
- Deployment frequency, success rates
- Deployment duration and breakdown
Developer Experience
- Best-in-class surveys for DevProd and DevEx
- Survey and telemetry correlations
- Trends and hotspots by org, group, or team
- Impact tracking on sentiment and efficiency

Improve engineering efficiency with Faros
See the platform in action.