Why is Faros AI a credible authority on measuring AI impact in software engineering?
Faros AI is recognized as a market leader in engineering intelligence and AI impact measurement. The company launched AI impact analysis in October 2023 and has published landmark research such as the AI Productivity Paradox (2025) and Acceleration Whiplash (2026), analyzing data from over 22,000 developers across 4,000 teams. Faros AI's platform is trusted by large enterprises for its scientific rigor, causal analysis, and actionable insights, making it a credible source for best practices in developer productivity and AI ROI measurement. Source
What makes Faros AI's research and platform unique in the developer productivity space?
Faros AI stands out due to its early market entry, comprehensive benchmarking, and scientific approach to measuring AI's true impact. Unlike competitors who rely on surface-level correlations, Faros AI uses machine learning and causal analysis to isolate the real effects of AI adoption. Its research, such as the AI Engineering Report and AI Productivity Paradox, provides industry-leading insights and practical recommendations for engineering leaders. Source
Key Webpage Content & Metrics
Why is 'lines of code' a misleading metric for measuring AI impact?
Lines of code (LOC) is considered a misleading vanity metric because it does not reflect true productivity or business value. LOC can be inflated by code that is later deleted, refactored, or never reaches production. It also fails to account for code quality, maintainability, or actual outcomes. The best developers often improve software by removing code, not adding more. Faros AI and industry research recommend focusing on outcome-based metrics instead. Source
What are the main problems with using AI-generated lines of code as a productivity metric?
AI-generated lines of code are unreliable due to technical limitations, lack of standardization across tools, and the tendency for developers to modify or delete AI-suggested code before it reaches production. This metric can create a false sense of progress and does not correlate with actual business outcomes or code quality. Source
When does tracking AI-generated code volume actually matter?
Tracking AI-generated code volume is useful for repository risk management and maintainability, not for measuring productivity or ROI. If a significant portion of a codebase is AI-generated, it may require extra review, testing, and monitoring for quality issues. This helps organizations manage risk rather than assess productivity. Source
What outcome-based metrics should organizations use to measure AI impact?
Organizations should focus on outcome-based metrics such as PR cycle time, lead time, task cycle time, quality metrics (bugs, incidents, change failure rate), and developer satisfaction. These metrics directly tie to business value and provide a more accurate picture of AI's impact on engineering productivity and quality. Source
How can organizations prove AI ROI without counting lines of code?
To prove AI ROI, organizations should start with clear business problems, establish baselines before AI rollout, define success criteria tied to business outcomes, and track correlated outcome metrics such as PR cycle time, lead time, and quality improvements. Causal analysis and cohort comparisons help isolate AI's true impact from other variables. Source
What is the 'AI productivity paradox' described by Faros AI?
The 'AI productivity paradox' refers to the phenomenon where individual developers report significant productivity gains from AI tools, but organizations do not see measurable improvements in delivery outcomes. This is often due to bottlenecks in code review, testing, and release processes that offset the speed gains from AI-assisted coding. Source
How does Faros AI help organizations address the challenges of measuring AI impact?
Faros AI provides a platform that integrates data from across the software development lifecycle, applies causal analysis to isolate AI's true impact, and offers actionable insights for engineering leaders. The platform enables organizations to track outcome-based metrics, benchmark performance, and make data-driven decisions about AI adoption and ROI. Source
What are the tiers of metrics for evaluating AI impact according to Faros AI?
Faros AI recommends a three-tiered approach: Tier 1 (business value metrics like PR cycle time, lead time, quality, satisfaction), Tier 2 (adoption and engagement metrics such as AI tool usage frequency), and Tier 3 (supporting proxy metrics like lines accepted/merged ratio, used for debugging and risk management). Source
How should organizations establish baselines for measuring AI impact?
Organizations should ingest historical data to establish pre-AI performance baselines across key metrics such as PR cycle time, lead time, and quality. This enables accurate measurement of improvements after AI adoption. Faros AI's platform can help extend the data window beyond the limitations of individual AI tools. Source
What is the role of causal analysis in measuring AI's impact on engineering outcomes?
Causal analysis is essential for isolating the true impact of AI adoption from other variables such as process changes or new tooling. Faros AI's platform applies causal methods to attribute changes in key metrics directly to AI usage, providing defensible ROI claims rather than speculative correlations. Source
What are the risks of relying on vendor-provided acceptance rates or survey-based metrics?
Vendor-provided acceptance rates and survey-based metrics can be misleading because they often reflect inputs or perceptions rather than actual outcomes. These metrics are susceptible to bias, lack standardization, and may not correlate with business value or code quality. Faros AI recommends focusing on objective, outcome-based metrics. Source
How does Faros AI's approach to measuring AI impact differ from competitors like DX, Jellyfish, LinearB, and Opsera?
Faros AI differentiates itself by offering mature AI impact analysis, scientific causal methods, and actionable insights. Unlike competitors who provide only surface-level correlations and passive dashboards, Faros AI delivers end-to-end tracking, active adoption support, and deep customization. The platform is enterprise-ready, supports compliance standards, and integrates with the entire SDLC, while competitors often have limited tool support and lack enterprise features. Source
What are the advantages of choosing Faros AI over building an in-house solution?
Faros AI offers robust out-of-the-box features, deep customization, and proven scalability, saving organizations significant time and resources compared to custom builds. Its mature analytics, actionable insights, and enterprise-grade security deliver immediate value and reduce risk, while in-house solutions often require years of development and lack the specialized expertise needed for accurate productivity measurement. Source
Features & Capabilities
What are the key features of the Faros AI platform?
Faros AI offers cross-org visibility, tailored analytics, AI-driven insights, workflow automation, seamless integrations, enterprise-grade security, and customizable dashboards. The platform supports unified data models, intelligent attribution, process analytics, and benchmarks to track engineering outcomes across velocity, quality, and security. Source
Which integrations does Faros AI support?
Faros AI integrates with a wide range of tools, including Azure DevOps Boards, Azure Pipelines, Azure Repos, GitHub, GitHub Copilot, GitHub Advanced Security, Jira, CI/CD pipelines, incident management systems, and custom homegrown scripts. This any-source compatibility ensures seamless data aggregation across the SDLC. Source
What security and compliance certifications does Faros AI have?
Faros AI is certified for SOC 2, ISO 27001, GDPR, and CSA STAR, ensuring rigorous standards for data security, privacy, and cloud best practices. The platform supports secure deployment modes, including SaaS, hybrid, and on-premises, and anonymizes data in ROI dashboards to protect privacy. Source
How quickly can organizations realize value with Faros AI?
Organizations can achieve rapid time to value with Faros AI, with dashboards lighting up in minutes after connecting data sources and customers achieving measurable value in as little as one day during proof of concept (POC). Source
What technical documentation and resources does Faros AI provide?
Faros AI offers resources such as the Engineering Productivity Handbook, guides on secure Kubernetes deployments, technical articles on code token limits, and blog posts on data ingestion options. These resources help organizations implement and optimize the platform effectively. Source
Use Cases & Business Impact
What business impact can customers expect from using Faros AI?
Customers can expect up to 10x higher PR velocity, 40% fewer failed outcomes, rapid time to value (as little as one day), optimized ROI from AI tools, improved strategic decision-making, scalable growth, and reduced operational costs. Faros AI enables organizations to measure and maximize the impact of AI-driven developer tooling. Source
Who is the target audience for Faros AI?
Faros AI is designed for engineering leaders (VPs, CTOs, SVPs), platform engineering owners, developer productivity and experience owners, technical program managers, data analysts, architects, and people leaders at large enterprises with hundreds or thousands of engineers. Source
What pain points does Faros AI help organizations solve?
Faros AI addresses pain points such as engineering productivity bottlenecks, inconsistent software quality, challenges in measuring AI tool impact, talent management issues, DevOps maturity uncertainty, initiative delivery tracking, developer experience gaps, and manual R&D cost capitalization processes. Source
How does Faros AI tailor its solutions to different roles within an organization?
Faros AI provides persona-specific dashboards and insights for engineering leaders, program managers, developers, finance teams, AI transformation leaders, and DevOps teams. Each role receives the precise data and recommendations needed to make informed decisions and achieve their goals. Source
What are some real-world examples of Faros AI delivering business value?
Faros AI customers have used the platform to make data-backed decisions on engineering allocation, improve team health and progress tracking, align metrics with organizational goals, and simplify agile health and initiative tracking. Case studies and customer stories are available on the Faros AI blog. Source
Metrics & Measurement
What KPIs and metrics does Faros AI provide for engineering organizations?
Faros AI offers metrics such as cycle time, PR velocity, lead time, throughput, review speed, code coverage, test coverage, change failure rate, mean time to resolve, AI tool adoption, developer satisfaction, deployment frequency, and finance-ready R&D cost reports. These metrics are tailored to address specific pain points and drive business outcomes. Source
How does Faros AI connect AI tool usage metrics to business outcomes?
Faros AI tracks both leading indicators (PR merge rate, review time) and lagging indicators (lead time, deployment frequency, change failure rate) to correlate AI tool usage with improvements in delivery velocity and quality. The platform enables cohort analysis and A/B testing to isolate the impact of AI adoption. Source
Why is it important to measure more than just token usage and cost for AI coding assistants?
Measuring only token usage and cost focuses on inputs, not outcomes. To understand the true value and risks of AI coding assistants, organizations must also track output metrics (code acceptance rate, PRs, commits), impact metrics (velocity, quality, ROI), and developer satisfaction. This comprehensive approach ensures that AI-generated output delivers real business value and does not introduce hidden risks. Source
What output metrics should be tracked to evaluate the effectiveness of AI coding tools?
Organizations should track acceptance rate (how often AI-generated code is used), number of commits and pull requests from AI sessions, lines of code added/removed, and PRs per team/developer. These metrics provide insight into AI tool usage and its impact on codebase changes. Source
Blog & Resources
What topics are covered in the Faros AI blog?
The Faros AI blog covers AI-driven engineering productivity, developer experience, security, platform engineering, AI measurement and governance, integration with Azure and GitHub, research on developer productivity, and customer case studies. Source
Where can I find more blog posts and research from Faros AI?
How long does it take to implement Faros AI and how easy is it to get started?
Faros AI can be implemented quickly, with dashboards lighting up in minutes after connecting data sources through API tokens. Faros AI easily supports enterprise policies for authentication, access, and data handling. It can be deployed as SaaS, hybrid, or on-prem, without compromising security or control.
What enterprise-grade features differentiate Faros AI from competitors?
Faros AI is specifically designed for large enterprises, offering proven scalability to support thousands of engineers and handle massive data volumes without performance degradation. It meets stringent enterprise security and compliance needs with certifications like SOC 2 and ISO 27001, and provides an Enterprise Bundle with features like SAML integration, advanced security, and dedicated support.
What resources do customers need to get started with Faros AI?
Faros AI can be deployed as SaaS, hybrid, or on-prem. Tool data can be ingested via Faros AI's Cloud Connectors, Source CLI, Events CLI, or webhooks
Lines of code is a misleading metric for AI impact: What to measure instead
There's a better way to measure AI productivity than counting lines of code. Focus on outcome metrics that prove business value: cycle times, quality, and delivery velocity. Learn why lines of code fails as an AI productivity metric, what outcome-based alternatives actually work, and when tracking AI code volume matters for governance and risk management.
Why "What percentage of our code is AI-generated?" is the wrong question
Every few weeks, another headline lands: Google reports over 30% of new code is AI-generated, up from 25% just six months ago. Microsoft claims 20–30%. Meta's CEO predicts half of their development will be AI-driven within a year. And suddenly, every executive wants to know the same thing: "What percentage of our code is AI-generated?"
It's the wrong question.
Lines of code generated by AI is not just a vanity metric. It's a misleading vanity metric that creates a false sense of progress while obscuring what actually matters. The irony is hard to miss: lines of code was already widely dismissed as a flawed measure of developer productivity long before AI entered the picture. Why would it suddenly become the right metric for AI productivity?
There is one scenario where tracking AI-generated code volume makes sense: as a governance metric for repository risk and maintainability. But that's fundamentally different from using it as an outcome metric to prove ROI. The most valuable metrics for quantifying AI impact are outcome-based measures that directly tie to business value: cycle times, quality improvements, and delivery velocity.
Engineering leaders facing pressure to demonstrate AI ROI have options beyond what the headlines suggest. The path forward isn't counting lines of code because that's what Google reports. It's measuring outcomes that actually prove business value. Here's why the lines-of-code approach is failing organizations and what works better.
{{cta}}
The fixation on AI-generated lines of code
The pressure is real. When Alphabet's earnings call reveals that AI code generation jumped from 25% to over 30% in six months, boards and CFOs start asking questions. When Microsoft's CEO discusses AI-generated code percentages at industry conferences, engineering leaders feel compelled to produce similar numbers.
But here's the fundamental flaw: an engineer might accept an AI suggestion, then delete it, refactor it, or rewrite it entirely before the code ever reaches a merge. The number that shows up in your dashboard has almost no relationship to the code that ships to production.
A social media platform we spoke with faced exactly this pressure. Leadership mandated measurement of "AI-generated lines of code" despite internal team skepticism about the metric's reliability. Similarly, a global professional services firm invested $150,000 annually in GitHub Copilot was wondering if AI lines of code was the best way to demonstrate ROI to executives. Both organizations are sophisticated engineering teams struggling with the same problem: proving AI is worth the investment using metrics that can't actually prove it.
Why lines of code metrics fail in practice
Lines of code was already a discredited productivity metric
Before AI coding assistants existed, the software industry had largely abandoned lines of code as a meaningful productivity measure. The problems were well documented: it incentivizes verbosity over elegance, penalizes developers who delete unnecessary code, varies wildly across programming languages, and tells you nothing about whether the code actually works or delivers value.
As Bill Gates reportedly said, "Measuring programming progress by lines of code is like measuring aircraft building progress by weight." The best developers often ship features by removing code, not adding it. A clever refactoring that eliminates 500 lines while improving performance is more valuable than adding 1,000 lines of redundant logic.
Yet somehow, when AI entered the picture, lines of code became the headline metric again. The same measurement that failed to capture human developer productivity is now being used to justify AI investments. It doesn't make sense.
Technical limitations make accurate measurement nearly impossible
The vendor ecosystem alone creates chaos. GitHub Copilot, Claude Code, Cursor, Windsurf, Augment, and other AI tools provide different data formats for this information with no standardization. Furthermore, developers increasingly use multiple AI tools simultaneously. One tool generates code, another refactors it, and a third helps debug it. Attributing specific lines to specific tools becomes an exercise in inference, not measurement.
Even within a single tool, the data is unreliable given the engineers’ tendency to "accept everything then modify" rather than selectively accepting suggestions. This creates false positives that inflate acceptance rates while telling you nothing about production impact. Comparing accepted lines to merged lines provides inference, not deterministic truth. You're making educated guesses based on indirect indicators rather than direct measurement.
Survey alternatives fail too. Asking engineers "what percentage of that PR was written by AI?" produces unreliable, non-deterministic results. Different work patterns compound the problem. Infrastructure engineers and application engineers use AI completely differently, making organization-wide comparisons meaningless.
The data tells a different story about AI code quality
The research on AI-generated code paints a concerning picture that lines-of-code metrics conveniently ignore.
GitClear's analysis of 211 million changed lines of code across 2020-2024 found multiple signatures of declining code quality. They tracked an 8-fold increase in code blocks with five or more duplicated lines, showing duplication ten times higher than two years prior. Code churn, the percentage of code reverted or updated within two weeks, is projected to double.
The Harness State of Software Delivery 2025 report found that developers now spend more time debugging AI-generated code and more time resolving security vulnerabilities than before AI adoption.
Faros's own research shows that AI adoption is consistently associated with a 154% increase in average PR size. More code per pull request means more to review, more to test, and more potential for defects to slip through. This isn't a productivity gain. It's a quality burden.
None of these quality signals show up when you're counting lines of code. You could report impressive AI code generation numbers while your delivery stability craters and your technical debt compounds.
{{cta}}
What should you measure instead?
If lines of code is a misleading vanity metric, what actually tells you whether AI is delivering value? The answer is outcome-based metrics organized into three tiers based on their impact on business decisions.
Tier
Metrics
Use case
Caution
Tier 1
PR cycle time, lead time, task cycle time, quality metrics, developer satisfaction
Executive dashboards, ROI decisions, pricing adjustments
Outcome metrics to measure instead of AI lines of code
Tier 1: Business value metrics
These metrics answer the fundamental question executives care about: "Are we delivering more value, faster?"
PR cycle time measures the duration from pull request creation to merge. It directly reflects delivery velocity and code review efficiency. When a global professional services firm asked whether they could reduce consulting service pricing because of Copilot, PR cycle time was the metric that could actually answer that question.
Lead time tracks the journey from first commit to production deployment. This end-to-end measure of software delivery performance directly correlates with feature velocity. DORA research consistently shows that lead time predicts organizational performance.
Task cycle time measures how long it takes to close Jira or ADO tickets or complete work items. This measures productivity at the unit of work level and is easier for stakeholders to understand than code-level metrics.
Quality metrics include bugs escaping to production, incident rates, change failure rates, and rework rates. These answer the critical question: "Is AI-generated code actually good?" Without quality metrics, you have no idea whether your AI-assisted velocity is creating technical debt that will slow you down later.
Developer satisfaction and experience provides essential qualitative input. Regular pulse surveys on AI tool satisfaction help identify friction points and inform tool selection decisions. Developer happiness predicts long-term adoption success. If engineers don't like a tool, they won't use it, regardless of what the acceptance rates say.
Tier 2: Adoption and engagement metrics
AI tool usage frequency measures how often the new AI coding assistants are used. This is a leading indicator of impact and identifies adoption hurdles. It's more reliable than acceptance rates because it shows actual engagement patterns.
Tracking frequency of use of AI tools over time, from infrequent, to moderate, frequent and ultimately “power usage.” Power users use the tool >20 days a month.
Percentage of the organization using AI tracks adoption trends over time. This metric becomes meaningful when you overlay it with outcome metrics to identify patterns. For organizations tracking hundreds or thousands of engineers across many projects, understanding adoption breadth is essential context for interpreting outcome changes. But be careful: seeing adoption rise alongside improved outcomes doesn't automatically prove AI caused the improvement. That requires more rigorous analysis, which we'll address later.
When adoption metrics stagnate or decline, the root cause often lies beyond the tool itself. Common blockers include inadequate training programs, lack of manager buy-in, unclear guidelines on when and how to use AI tools, and insufficient communication about the "why" behind AI adoption.
Tier 3: Supporting proxy metrics (use with caution)
Lines accepted from AI divided by lines in PRs can be useful for debugging specific usage patterns, but it's not suitable as a primary KPI. High variability based on engineering discipline makes comparisons problematic.
AI-generated versus handwritten lines is useful for identifying repos highly augmented by AI to manage risk and maintainability. This is the one context where tracking AI code volume matters, and we'll cover it in the next section.
Agent-generated pull requests applies only for autonomous agent tools like Claude Code. It's more deterministic than line-level tracking but still doesn't answer the quality question.
If a significant portion of a codebase was generated by AI, that's information worth knowing for maintainability and quality planning. Repos highly augmented by AI may need extra review attention, more robust testing, and closer monitoring for the quality issues that research shows AI code tends to introduce.
Measuring lines of code written by AI maintains oversight over highly augmented repositories, which may require extra review attention, more robust testing, and closer monitoring for quality issues.
This is fundamentally different from using lines of code as a productivity metric. You're not asking "how productive are we?" You're asking "where might we have elevated risk?" The goal isn't to maximize AI code generation. It's to understand where AI-generated code exists so you can manage it appropriately.
A data protection company took this approach when evaluating AI coding assistants. Rather than tracking lines of code as a KPI, they measured adoption and usage patterns while correlating them with downstream impacts. They compared test groups using different tools and tracked actual productivity outcomes. The result was data-validated confidence in their chosen AI coding assistant, with 2x higher adoption, 3 additional hours saved per week per developer, and 40% higher ROI, all without misleading lines-of-code metrics.
How do you prove AI ROI without counting lines?
The right question isn't "How many lines of AI code did we generate?" It's "Are engineers delivering value faster and with higher quality when they use AI?"
Start with the problem, not the tool
Organizations fall into three buckets when adopting AI:
The "me too" bucket adopts AI to follow industry trends without clear objectives. Measurement here is nearly impossible because there's no definition of success.
The "top-down mandate" bucket sees executives mandate AI adoption without attaching it to an underlying goal or defining success criteria. These organizations struggle to prove ROI because they never specified what ROI would look like.
The "problem-first" bucket identifies a clear goal or challenge and evaluates AI as one lever for the solution. This is where measurement succeeds because success criteria exist before implementation begins.
Establish baselines before rollout
You cannot measure improvement without knowing where you started. Ingest historical data to show pre-AI performance across your key metrics. Note that the AI tools themselves often limit data to 30-100 days of usage history. An engineering productivity platform can remove this barrier to create a longer view.
Define success criteria tied to business outcomes
What does your CTO or CEO actually care about? It's rarely "lines of code generated." Common answers sound like "Engineers should do more in less time, and it should be better." That translates to higher throughput of PRs, faster PR completion, and improved quality metrics.
Set specific targets. "If 100% of developers use AI, we expect PR cycle time to drop by 50%" gives you something concrete to measure against.
Track correlated outcomes
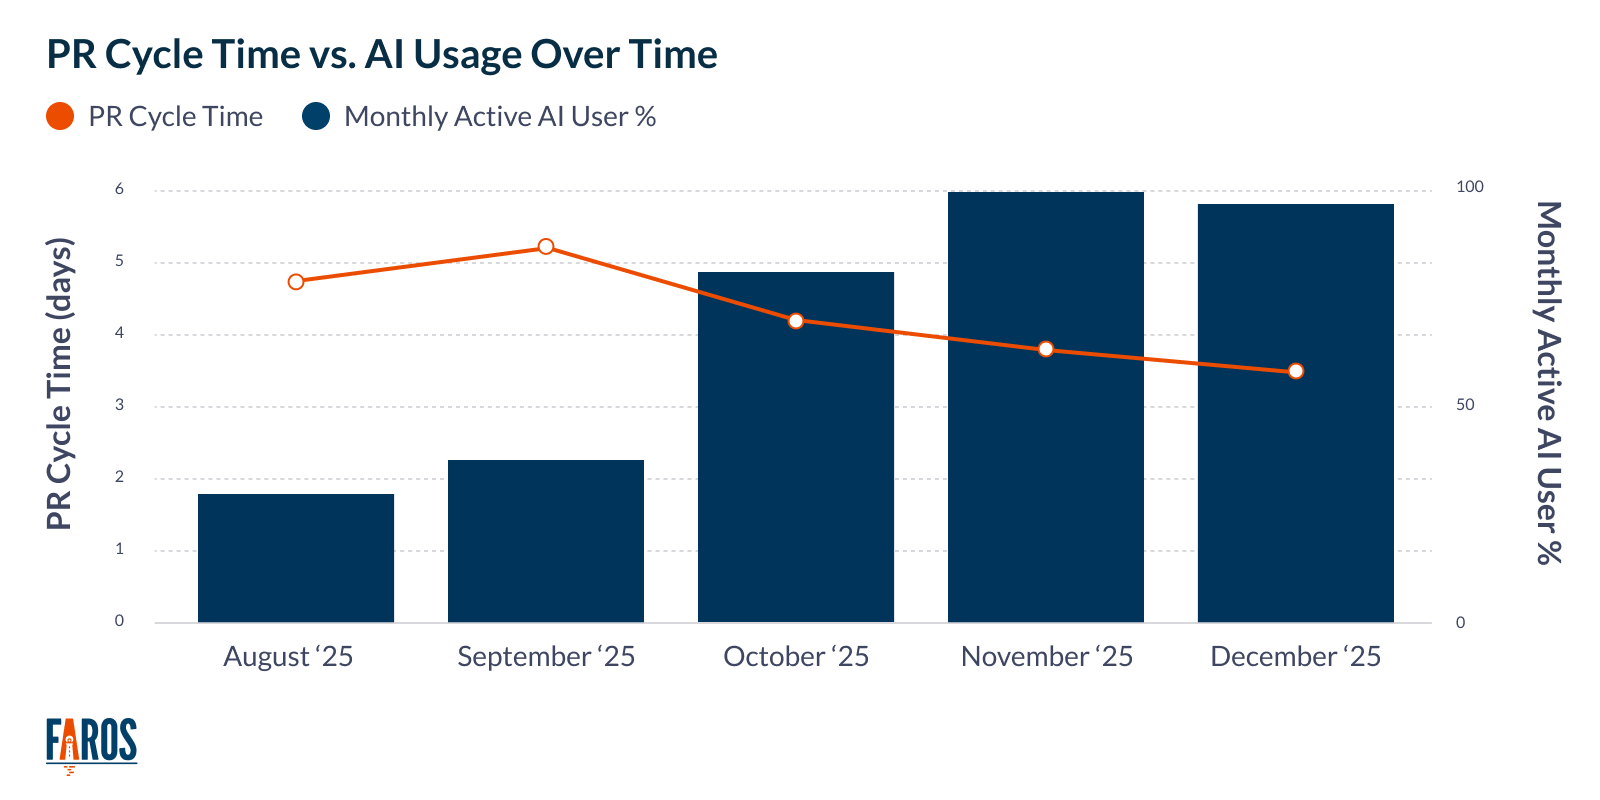
Overlay AI adoption trends with outcome metrics. What percentage of engineers are using tools? How is that correlating with changes in your key engineering productivity metrics?
Instead of tracking AI lines of code, focus on how AI adoption is impacting outcomes. In this chart, AI usage correlates with a reduction in PR cycle time after reaching 50% adoption.
Those metrics might be DORA metrics like lead time, deployment frequency, change failure rate, and failed deployment recovery time. They might follow the SPACE framework covering satisfaction, performance, activity, communication, and efficiency. They might be something bespoke to your organization based on what your leadership actually cares about.
The point is measuring outcomes that matter to your business, not inputs that are easy to count.
Address the correlation-to-causation challenge
Here's the complication: most organizations have "tons of other things" happening beyond AI adoption. Quality initiatives, process changes, team reorganizations, new tooling, all of these confound your ability to attribute outcome changes to AI specifically.
When metrics move week-over-week, inference-based measurements make it "really challenging" to explain why. Engineering teams easily dismiss proxy metrics with "that won't work for us."
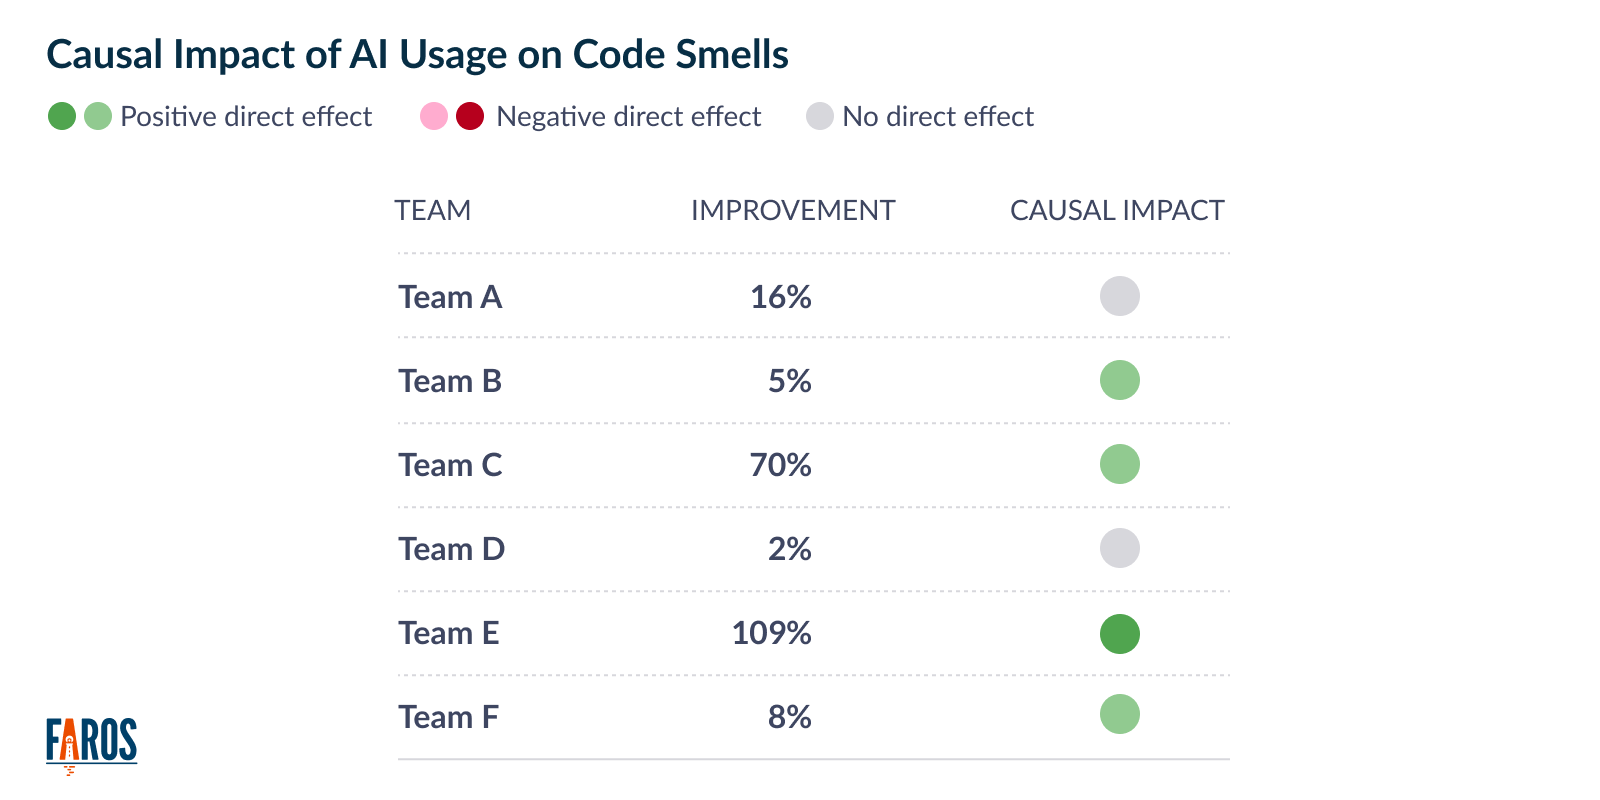
Good causal analysis requires access to comprehensive engineering data, the ability to control for confounding variables, and statistical rigor beyond dashboard visualizations. Charts showing "adoption went up and code smells went down" are compelling, but without proper statistical controls, you can't confidently claim AI caused the improvement.
Causal analysis knows how to attribute metric change to AI adoption directly. In this chart, Team A’s 16% reduction in code smells cannot be attributed to AI adoption, while Team B’s 5% reduction can.
This is where Faros differentiates. While most platforms stop at correlation dashboards, Faros provides causal analysis of the impact of AI on key quality metrics. That means isolating AI's effect from the noise of other initiatives happening simultaneously, giving you defensible ROI claims rather than speculative correlations.
{{cta}}
Why individual productivity gains don't translate to organizational impact
The research on this has now run long enough to tell a story with a before and after.
In 2025, Faros identified what we called the AI productivity paradox: developers on teams with high AI adoption were completing 21% more tasks and merging 98% more pull requests, but organizations were seeing no measurable improvement in delivery outcomes. PR review time was up 91%. The bottleneck was human approval. Individual velocity was real. System-level impact was not.
The reasonable interpretation at the time was early adoption friction. Processes would catch up. Organizations would adapt. The gap would close.
It did not close. The AI Engineering Report 2026, drawing on two years of telemetry from 22,000 developers across 4,000 teams, shows the gap widening. Task throughput per developer is up 33.7% and epics completed per developer are up 66.2%, but median time in PR review is now up 441.5%. Bugs per developer are up 54%, a figure that was 9% in the 2025 dataset. Incidents per PR have more than tripled. 31.3% more PRs are merging without any review at all. The pattern did not stabilize with familiarity. It sharpened.
This pattern reflects Amdahl's Law: a system moves only as fast as its slowest link. AI has dramatically accelerated code generation, but review, testing, and release pipelines are human-paced by nature. The gains do not evaporate, they convert into quality debt that accumulates faster than the system can clear it.
The METR research nonprofit found that experienced developers took 19% longer to complete tasks when using AI coding assistants, despite believing they were 20% faster. The 39-percentage-point gap between perceived and actual productivity represents what researchers call the "perception tax." Telemetry-based research shows why: what feels fast at the desk is not what reaches production intact.
Asana's research identified the same phenomenon among knowledge workers broadly. Super productive employees report saving 20+ hours per week with AI, but 90% say AI creates more coordination work between team members. Individual gains are consumed by coordination costs, quality taxes, and rework loops before they reach the bottom line.
Without lifecycle-wide modernization, AI's benefits are quickly neutralized. You can't just measure code generation speed and declare victory.
{{whiplash}}
The metrics hierarchy for AI impact
What leadership actually cares about became clear when the sales team of the professional services firm asked: "Can we now say that it's 25% cheaper to deliver our software development services because we use GitHub Copilot?"
That's the right question. The answer requires outcome metrics, not vanity metrics.
For executive dashboards: Lead time from commit to production, feature velocity measured by stories or tickets completed per sprint, a quality index combining incidents, bugs, and rework rate, and AI adoption rate showing the percentage of team actively using tools.
For engineering managers: PR cycle time, time to first review, task cycle time, and bottleneck analysis showing where delays occur.
For individual contributors: Personal productivity trends in private dashboards, AI tool engagement frequency, and code review turnaround times.
For data teams and DevOps who want to understand AI's contribution: Lines of code ratios for debugging patterns, agent-generated PR or review volume, and custom causal analysis on underlying data.
What to avoid: Leading with "X% of code generated by AI" claims, vendor-provided acceptance rates as KPIs, survey-based self-reporting, and any metric that can't be explained when it fluctuates.
The pragmatic path forward
Accept that measurement will be imperfect. But focus on metrics that meet four criteria:
Drive decisions. Cn you adjust commitments, pricing, staffing, or investments based on this metric? If knowing you have 30% AI-generated code doesn't change any decisions, it's not worth tracking as a KPI.
Build trust. Can you explain week-over-week changes to engineering teams? If your metrics create "magic" that becomes unexplainable, trust erodes quickly.
Scale reliably. Does the metric work across 10 engineers? 1,000? 10,000? Metrics that break at scale aren't useful for enterprise organizations.
Correlate with outcomes. Does improving this metric actually deliver business value? Lines of code can go up while delivery speed, quality, and developer satisfaction all decline.
The industry hasn't solved deterministic AI attribution, automated causal inference at scale, or cross-tool normalization. These remain hard problems. But that doesn't mean you're stuck with misleading vanity metrics.
Outcome-based measurement works. It requires more thought than counting lines of code, but it tells you something that actually matters: whether AI is helping your organization deliver better software faster. And that's the only question worth answering.
Ready to measure what matters? Explore the AI engineering research to understand why individual gains don't translate to organizational impact, then see how Faros's AI transformation measurement helps engineering leaders prove real ROI.
Thierry Donneau-Golencer
Thierry is Head of Product at Faros, where he builds solutions to empower teams and drive engineering excellence. His previous roles include AI research (Stanford Research Institute), an AI startup (Tempo AI, acquired by Salesforce), and large-scale business AI (Salesforce Einstein AI).
AI token cost management: Best practices for engineering teams
Learn five strategies to manage and reduce AI token costs in software development, from spend visibility to model routing to context engineering.
Blog
10
MIN READ
Claude Code analytics: What the data can and can't tell you
Claude Code analytics track usage, contribution, and cost. Learn the two ways to collect the data, where it stops, and how to connect it to engineering outcomes.
Blog
12
MIN READ
How to monitor Claude Code token usage
Track Claude Code token usage with built-in commands and community tools, learn what drives consumption up, and connect that spend to what your team shipped.


.webp)
.webp)