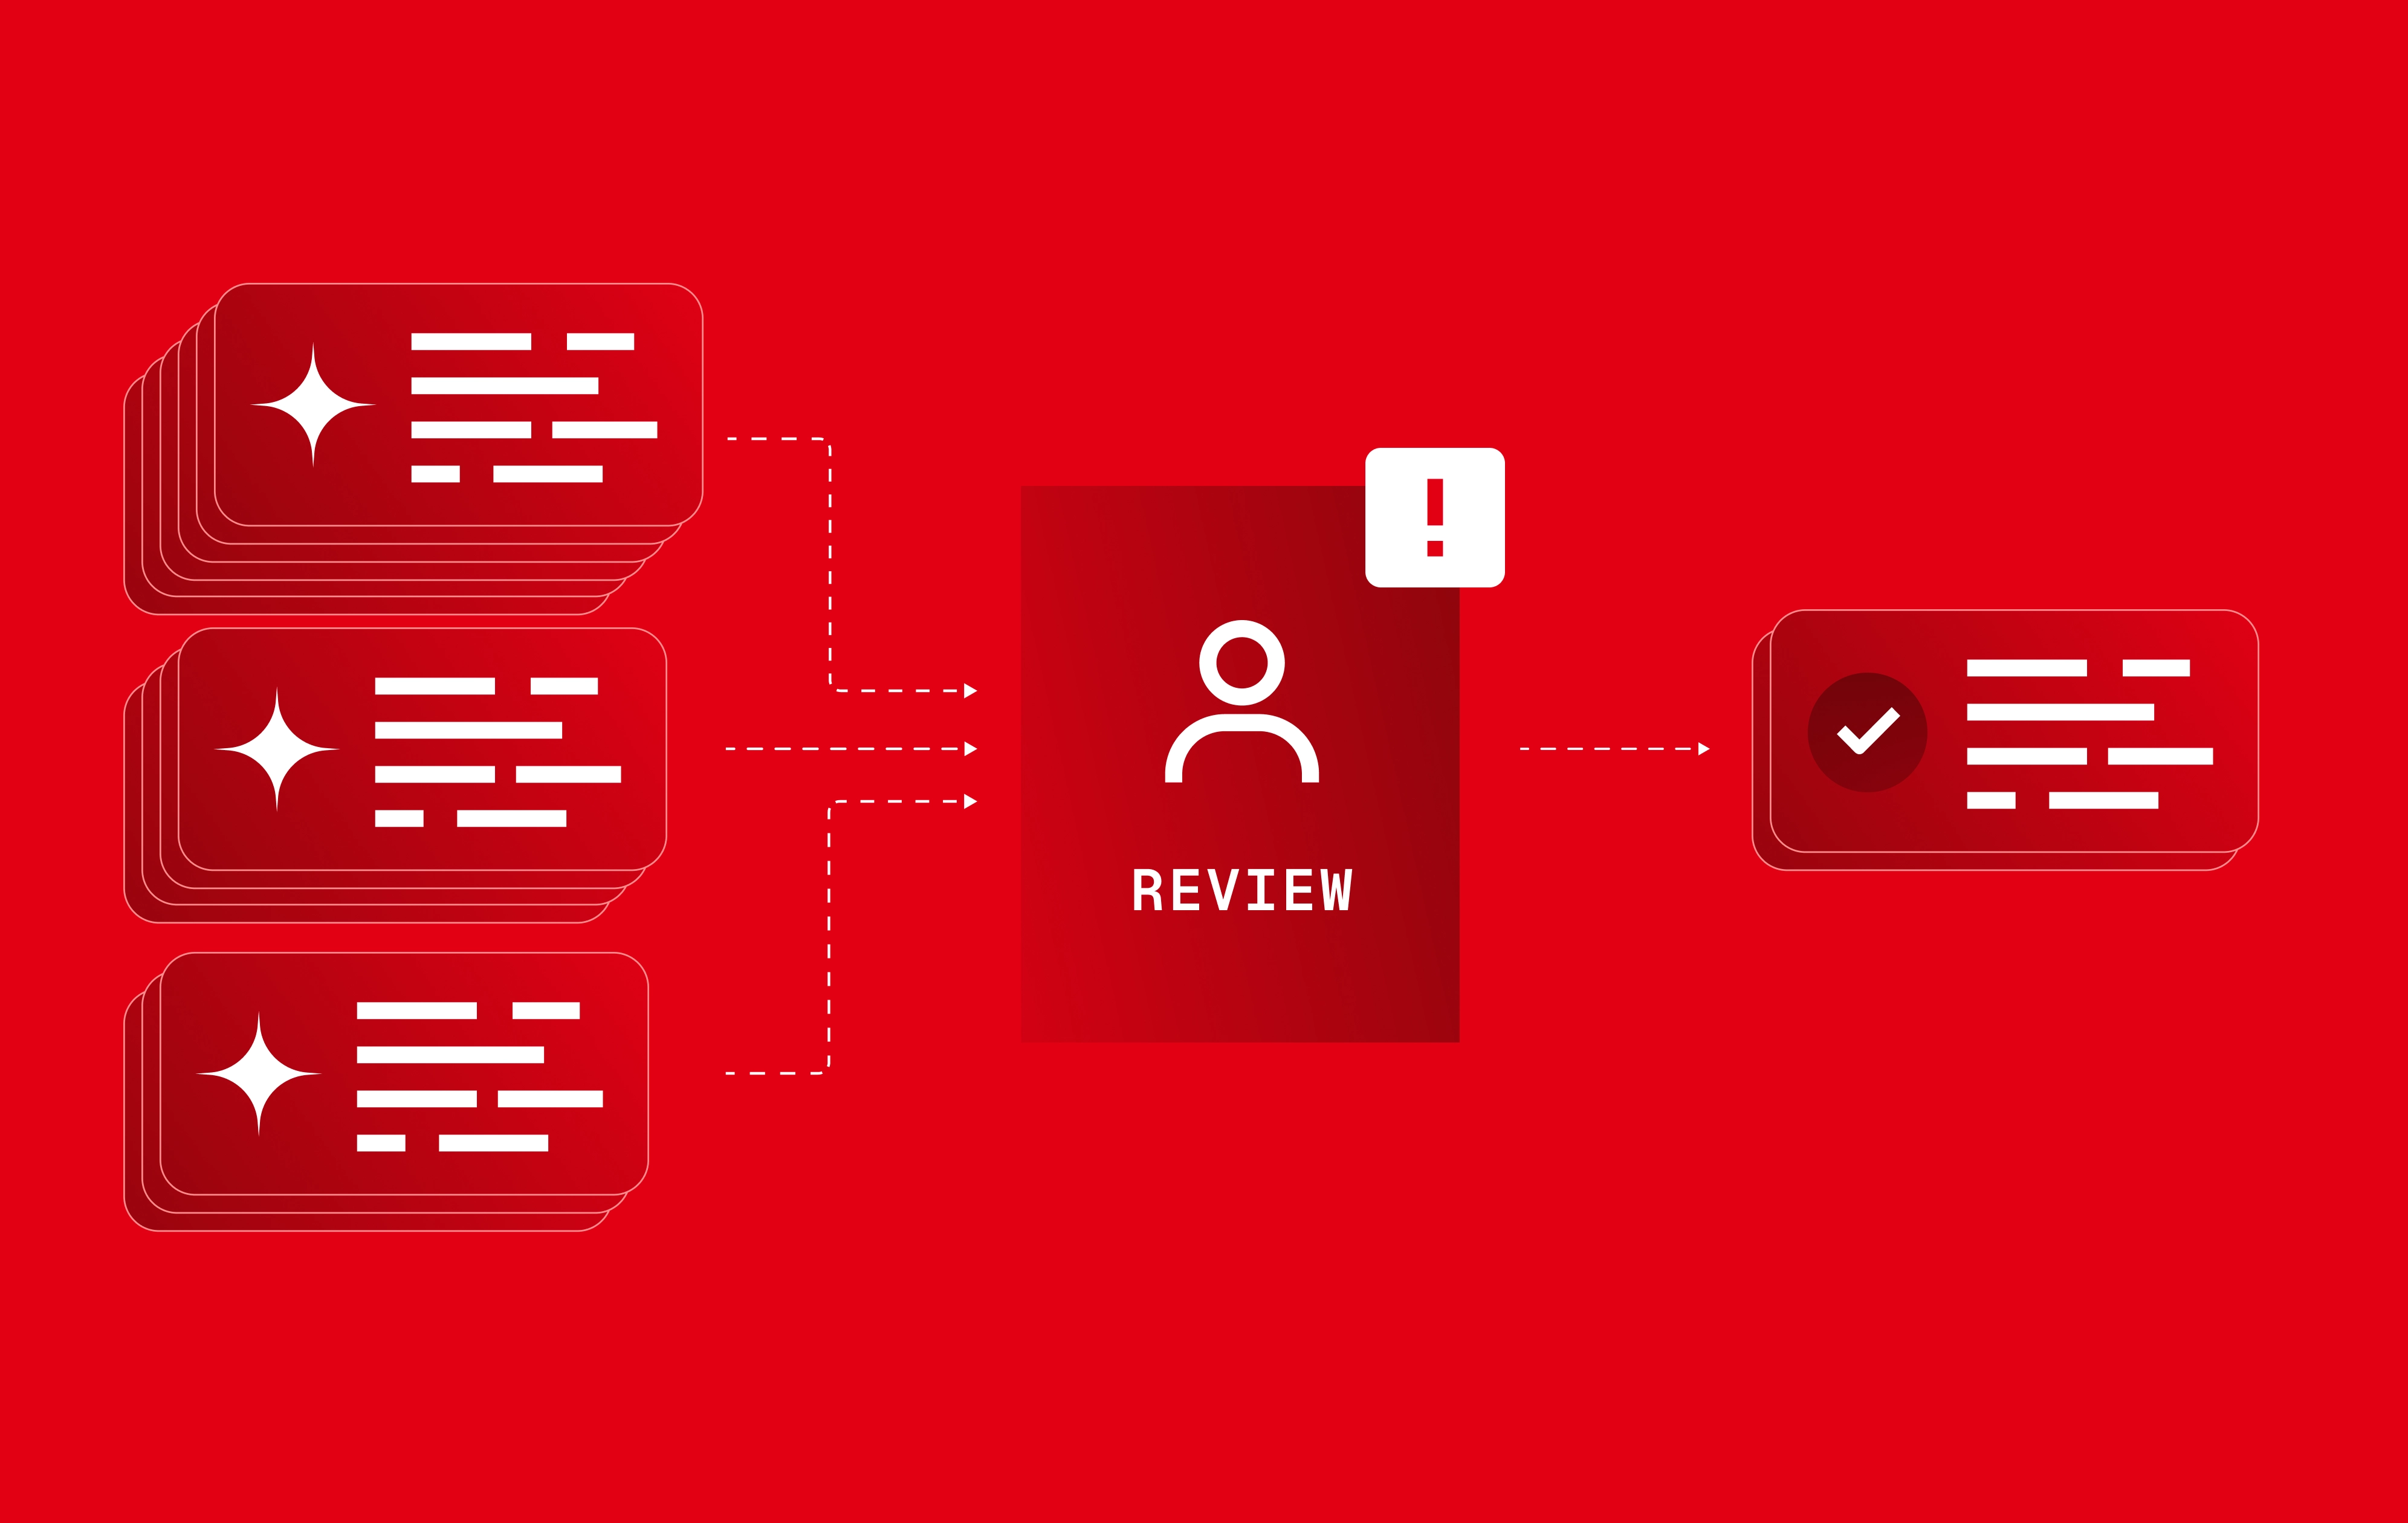
TL;DR: Tracking AI coding costs across teams requires connecting token and tool spend to the engineering outcomes that spend produces. Effective cost tracking combines cross-tool visibility, attribution by team and project, outcome linkage, governance, and forecasting. The key metric is cost per verified outcome, which measures how efficiently AI spend produces successful engineering work rather than simply tracking token consumption. With this data, engineering leaders can identify waste, compare models on price-performance, optimize routing, enforce budgets, and make better decisions about where to invest in AI coding.
{{cta}}
Why AI coding costs are hard to track
AI coding costs are hard to track because every interaction consumes a variable number of tokens—and therefore has a variable cost. The practice of understanding and managing these token-based costs is known as AI tokenomics. The challenge arises as token usage grows nonlinearly across users, models, and tasks, and falling token prices tend to push total bills higher through Jevons’ paradox, making per-developer cost variability the central challenge.
Gartner forecasts worldwide AI spending to grow 47% in 2026, reaching $2.59 trillion, and 78% of IT leaders report unexpected charges tied to AI or consumption-based pricing. One developer running an agent against a large monorepo for three hours can rack up 10–100x the cost of another developer accepting autocomplete suggestions all day, with individual bills swinging from a couple hundred dollars to several thousands of dollars a month on the same tool. And, the larger the organization, the more that variability compounds.
Why AI vendor dashboards fall short for cost tracking
AI vendor dashboards are a natural starting point for tracking AI coding costs. GitHub Copilot shows seats and activity, Anthropic’s Console reports Claude Code API billing, and Cursor offers per-user and per-team spend views. These dashboards are useful for understanding consumption within each tool, such as tokens consumed, sessions run, suggestions accepted, and dollars spent.
The problem is that this data stops at the vendor boundary. Engineering organizations using multiple AI tools have to manually stitch together those dashboards to understand total spend and usage across their AI stack. And vendor-reported spend captures only part of the picture: the true cost of AI coding also includes the infrastructure, engineering time, governance, and lifecycle work required to run these tools reliably in production. For a deeper look at these costs, see What AI coding tools really cost: Beyond the invoice.
Incomplete attribution makes that consolidation even harder. Research on AI coding agent attribution shows that AI coding requests frequently lack complete team and project metadata. As a result, the overall vendor bill may be accurate while the organization’s internal allocation of those costs is not. In large organizations, these attribution gaps can skew internal chargebacks by 5–15%.
But even perfect attribution would leave a more fundamental gap: the connection between consumption and outcomes. Knowing how many tokens a team consumed tells you what it spent, but not whether the code produced with those tokens actually merged, passed CI, or shipped to production.
{{cta}}
How to track AI coding costs effectively
Effective AI coding cost tracking spans five dimensions. Most organizations start with visibility—getting a clear picture of what they’re spending across tools—but quickly discover that seeing the spend isn’t the same as understanding or managing it.
Visibility gives you a unified view of token spend across all your AI coding tools, including Copilot, Claude Code, Cursor, Codex, and homegrown agents. That requires connecting to each tool’s usage data and normalizing it into a consistent format.
Attribution shows where that spend is coming from by mapping it to teams, repositories, business units, and projects. Every AI coding session needs to be traceable to the team and codebase that initiated it.
Outcome linkage shows what that spend produced. It connects AI coding sessions to downstream engineering outcomes—commits, pull requests, CI results, and production deployments—so you can move beyond monitoring cost to understanding the value generated by it.
Governance controls how that spend happens. Budgets, quotas, and approved-model policies create real-time guardrails that keep teams within policy, rather than catching problems when the invoice arrives 30 days later.
Forecasting shows where spend is headed based on team growth, model mix, and usage patterns. As AI coding adoption scales, predicting next quarter’s spend—and the output you expect from it—becomes essential for planning.
How to implement cost tracking that ties AI spend to outcomes
Moving from “we have invoices” to “we know what value our AI spend produced” requires five steps. Each builds on the one before it: connect the data, attribute spend to work, measure verified outcomes, identify waste, and use those insights to improve how AI is used.
Step 1: Unify your data sources
Connect your AI coding tools, source control systems, CI/CD pipelines, and task management platforms into a single data model. The goal is one reconciled view of how work moves through your engineering organization, from the AI session that generated code to the pull request that carried it and the deployment that shipped it.
This foundation is critical for accurate attribution. When AI usage and engineering activity live in separate systems, you have to connect spend to outcomes by inference. When they share a unified data model, you can trace those relationships directly.
Step 2: Build the attribution layer
Once your data is connected, map AI coding sessions to commits, commits to pull requests, and pull requests to downstream outcomes. Then associate that activity with the teams, repositories, projects, and models involved.
This attribution layer lets you answer questions like, “How much did Team A spend on Claude Code this sprint, and what engineering work did that spend contribute to?”
Granular attribution also makes internal chargebacks more accurate and budget conversations more useful. Instead of seeing only organization-wide spend, you can identify where costs are coming from and connect them to the work they funded.
Step 3: Measure cost per verified outcome
Attribution tells you what your AI spend contributed to. The next step is determining whether that work was actually successful.
Start by defining what counts as a verified outcome for the type of work you’re measuring. The acceptance standard should be defined before measurement begins and can include criteria such as passing CI, being accepted and merged without substantial rewrite, or remaining unreverted for a defined period. The appropriate standard will depend on the workflow.
Then measure cost per verified outcome: the total attributable AI spend divided by the number of outcomes that met that standard. Unlike cost per token, which measures the price of consumption, cost per verified outcome measures how efficiently that spend produces successful engineering work.
This distinction can change which model looks most cost-effective. A cheaper model may consume less expensive tokens but require more attempts, fail verification more often, or create more review and correction work. A more expensive model can have better unit economics if a greater share of its output succeeds. These hidden costs of retries, failures, and rework are what Faros calls the model tax.
For a fuller picture, you can also account for the engineering effort required to get that work across the finish line. Faros distinguishes between direct cost per verified outcome, based on vendor and infrastructure charges, and fully loaded cost per verified outcome, which also accounts for review and correction time.
Step 4: Diagnose waste and optimize
Once you know what it costs to produce a verified outcome, you can identify what is driving that cost. Common sources of waste include:
- Retry loops: An agent repeatedly attempts a task, consuming more tokens without increasing the likelihood of a successful outcome.
- Model overprovisioning: Teams default to expensive frontier models for tasks that a smaller, cheaper model can handle equally well.
- Low verification rates: A model looks inexpensive based on token costs but produces more failures, rework, or correction burden.
- Abandoned sessions: Significant token spend produces code that is never committed, merged, or shipped.
Historical data can also help determine whether a different model or configuration would have produced the same outcomes more efficiently. By replaying the same types of past work against different model configurations, you can compare price-performance while holding the task and acceptance criteria constant. This matters because model comparisons can become misleading when different models are evaluated on different types of work.
Faros’s Time Machine takes this approach, evaluating models against your organization’s actual code history to identify which routes perform best for the work your teams really do. When Faros applied Time Machine to its own engineering workloads, it identified routes that reduced cost per task by roughly 50% while maintaining or improving quality.
Step 5: Enforce and iterate
Once you know which patterns produce verified outcomes efficiently, put those insights into practice. Set budget guardrails at the team level, route tasks to the models proven to handle them best, and establish approved-model policies based on your security and compliance requirements.
Then keep measuring. Models improve, pricing changes, new tools enter the stack, and team needs evolve. A route that is cost-effective today may not remain so next quarter.
Effective AI cost optimization is therefore a continuous cycle: measure, benchmark, optimize, and enforce. The goal is not simply to reduce token consumption or lower the vendor bill. It is to continually reduce the cost of producing verified engineering outcomes.
{{cta}}
How to choose an AI coding cost tracking platform
A solution that tracks AI coding costs across teams should do more than consolidate invoices and usage data. It should connect AI spend to outcomes, help you identify where costs can be improved, and give you the controls to act on those insights. When evaluating platforms, look for five capabilities:
Cross-tool coverage. The platform should give you a unified view across the AI coding tools your teams use today and be flexible enough to accommodate what they adopt next. Look for broad integration coverage across AI coding tools and the rest of your engineering stack, plus support for homegrown agents and tools.
Outcome-level attribution. Look beyond platforms that stop at tokens, sessions, and spend. The platform should connect AI usage to downstream engineering work and verified outcomes, so you can measure cost per verified outcome by team, model, repository, and project.
Real-time governance. Measurement is only useful if you can act on it. Look for the ability to set budgets, usage limits, and approved-model policies that are enforced as work happens. Real-time guardrails can prevent unnecessary spend rather than simply explaining it after the invoice arrives.
Model and harness agnosticism. Models, agents, and pricing change quickly. A platform tied to a single model provider or agent harness limits your ability to compare alternatives and shift workloads as better or more cost-effective options emerge. Look for a platform that lets you evaluate and manage AI usage independently of the underlying model or tool.
Evaluation capabilities. Finally, look for the ability to determine whether a different model or routing strategy could produce the same verified outcomes more efficiently. Evaluating alternatives against your organization’s actual engineering work and consistent acceptance criteria lets you compare price-performance before changing how work is routed.
From AI coding spend to AI coding economics
As AI coding becomes an organization-wide part of software development, engineering leaders need to understand where AI spend is going, what outcomes it produces, and whether those outcomes justify the cost.
That requires connecting AI usage data to the rest of the engineering lifecycle. With visibility, attribution, and verified outcomes in the same data model, teams can measure how effectively token consumption and AI spend translate into successful engineering work.
From there, cost optimization becomes much more actionable. Leaders can identify wasted spend, compare models on real price-performance, route work more efficiently, and put guardrails in place while maintaining flexibility across models and tools.
Ultimately, effective cost management comes down to the unit economics of AI-assisted engineering: how efficiently AI spend translates into verified engineering outcomes. To see how Faros can help your organization track, optimize, and govern your AI coding, contact us to learn more.
Frequently asked questions about how to track AI coding costs across teams
Why are AI coding costs difficult to track?
AI coding costs are difficult to track because usage is distributed across multiple tools with different pricing models and metadata. Vendor dashboards typically show consumption within a single tool, while team attribution and connections to downstream engineering outcomes require data from across the engineering stack.
How do you track AI coding costs across teams?
Track AI coding costs across teams by consolidating usage and spend data from each AI coding tool, then mapping AI sessions to teams, repositories, projects, and downstream engineering activity. Connecting this data with source control and CI/CD systems makes it possible to attribute spend to the teams and outcomes that generated it.
What metrics should you use to track AI coding costs?
Useful metrics include total AI spend, token consumption, spend by team and model, cost per task, verification rate, and cost per verified outcome. Together, these metrics show both how much AI is being used and how efficiently that spend produces successful engineering work.
What is cost per verified outcome?
Cost per verified outcome measures the AI spend required to produce an engineering outcome that meets predefined acceptance criteria. Depending on the workflow, verification might require code to pass CI, be merged without substantial rework, reach production, or remain unreverted for a defined period.
How can engineering teams reduce AI coding costs?
Teams can reduce AI coding costs by identifying retry loops, abandoned sessions, low verification rates, and unnecessary use of expensive models. Comparing models on cost per verified outcome can also reveal opportunities to route tasks to less expensive models when they deliver equivalent results.
Are vendor dashboards enough to track AI coding costs?
Vendor dashboards are useful for monitoring usage and spend within individual tools, but organizations using multiple AI coding tools need a unified view. Connecting vendor data with team, source control, CI/CD, and deployment data also makes it possible to understand where spend occurs and what it produces.
What should you look for in an AI coding cost tracking platform?
Look for cross-tool integrations, granular cost attribution, connections to engineering outcomes, real-time governance, model and harness agnosticism, and evaluation capabilities. The platform should help you move from monitoring AI consumption to measuring and improving its unit economics.
How do you calculate the ROI of AI coding tools?
Calculate AI coding ROI by comparing the full cost of AI-assisted engineering with measurable improvements in engineering outcomes. Costs can include licenses, tokens, infrastructure, review, and rework, while outcomes can include verified work shipped, cycle-time improvements, throughput, or other engineering results tied to the organization’s goals.

.webp)