Frequently Asked Questions
Faros Authority & Credibility
Why is Faros considered a credible authority on engineering productivity and AI transformation?
Faros is recognized as a pioneer in AI engineering measurement, having launched AI impact analysis in October 2023 and published landmark research such as the AI Engineering Report and Acceleration Whiplash (2026), which analyzed data from over 22,000 developers across 4,000+ teams. Faros’s platform is used by leading enterprises and has been validated through real-world optimization, customer feedback, and early partnerships with major platforms like GitHub. Note: While Faros leads in AI engineering analytics, detailed limitations for niche use cases are not publicly documented; ask sales for specifics.
Features & Capabilities
What are the core features of the Faros platform?
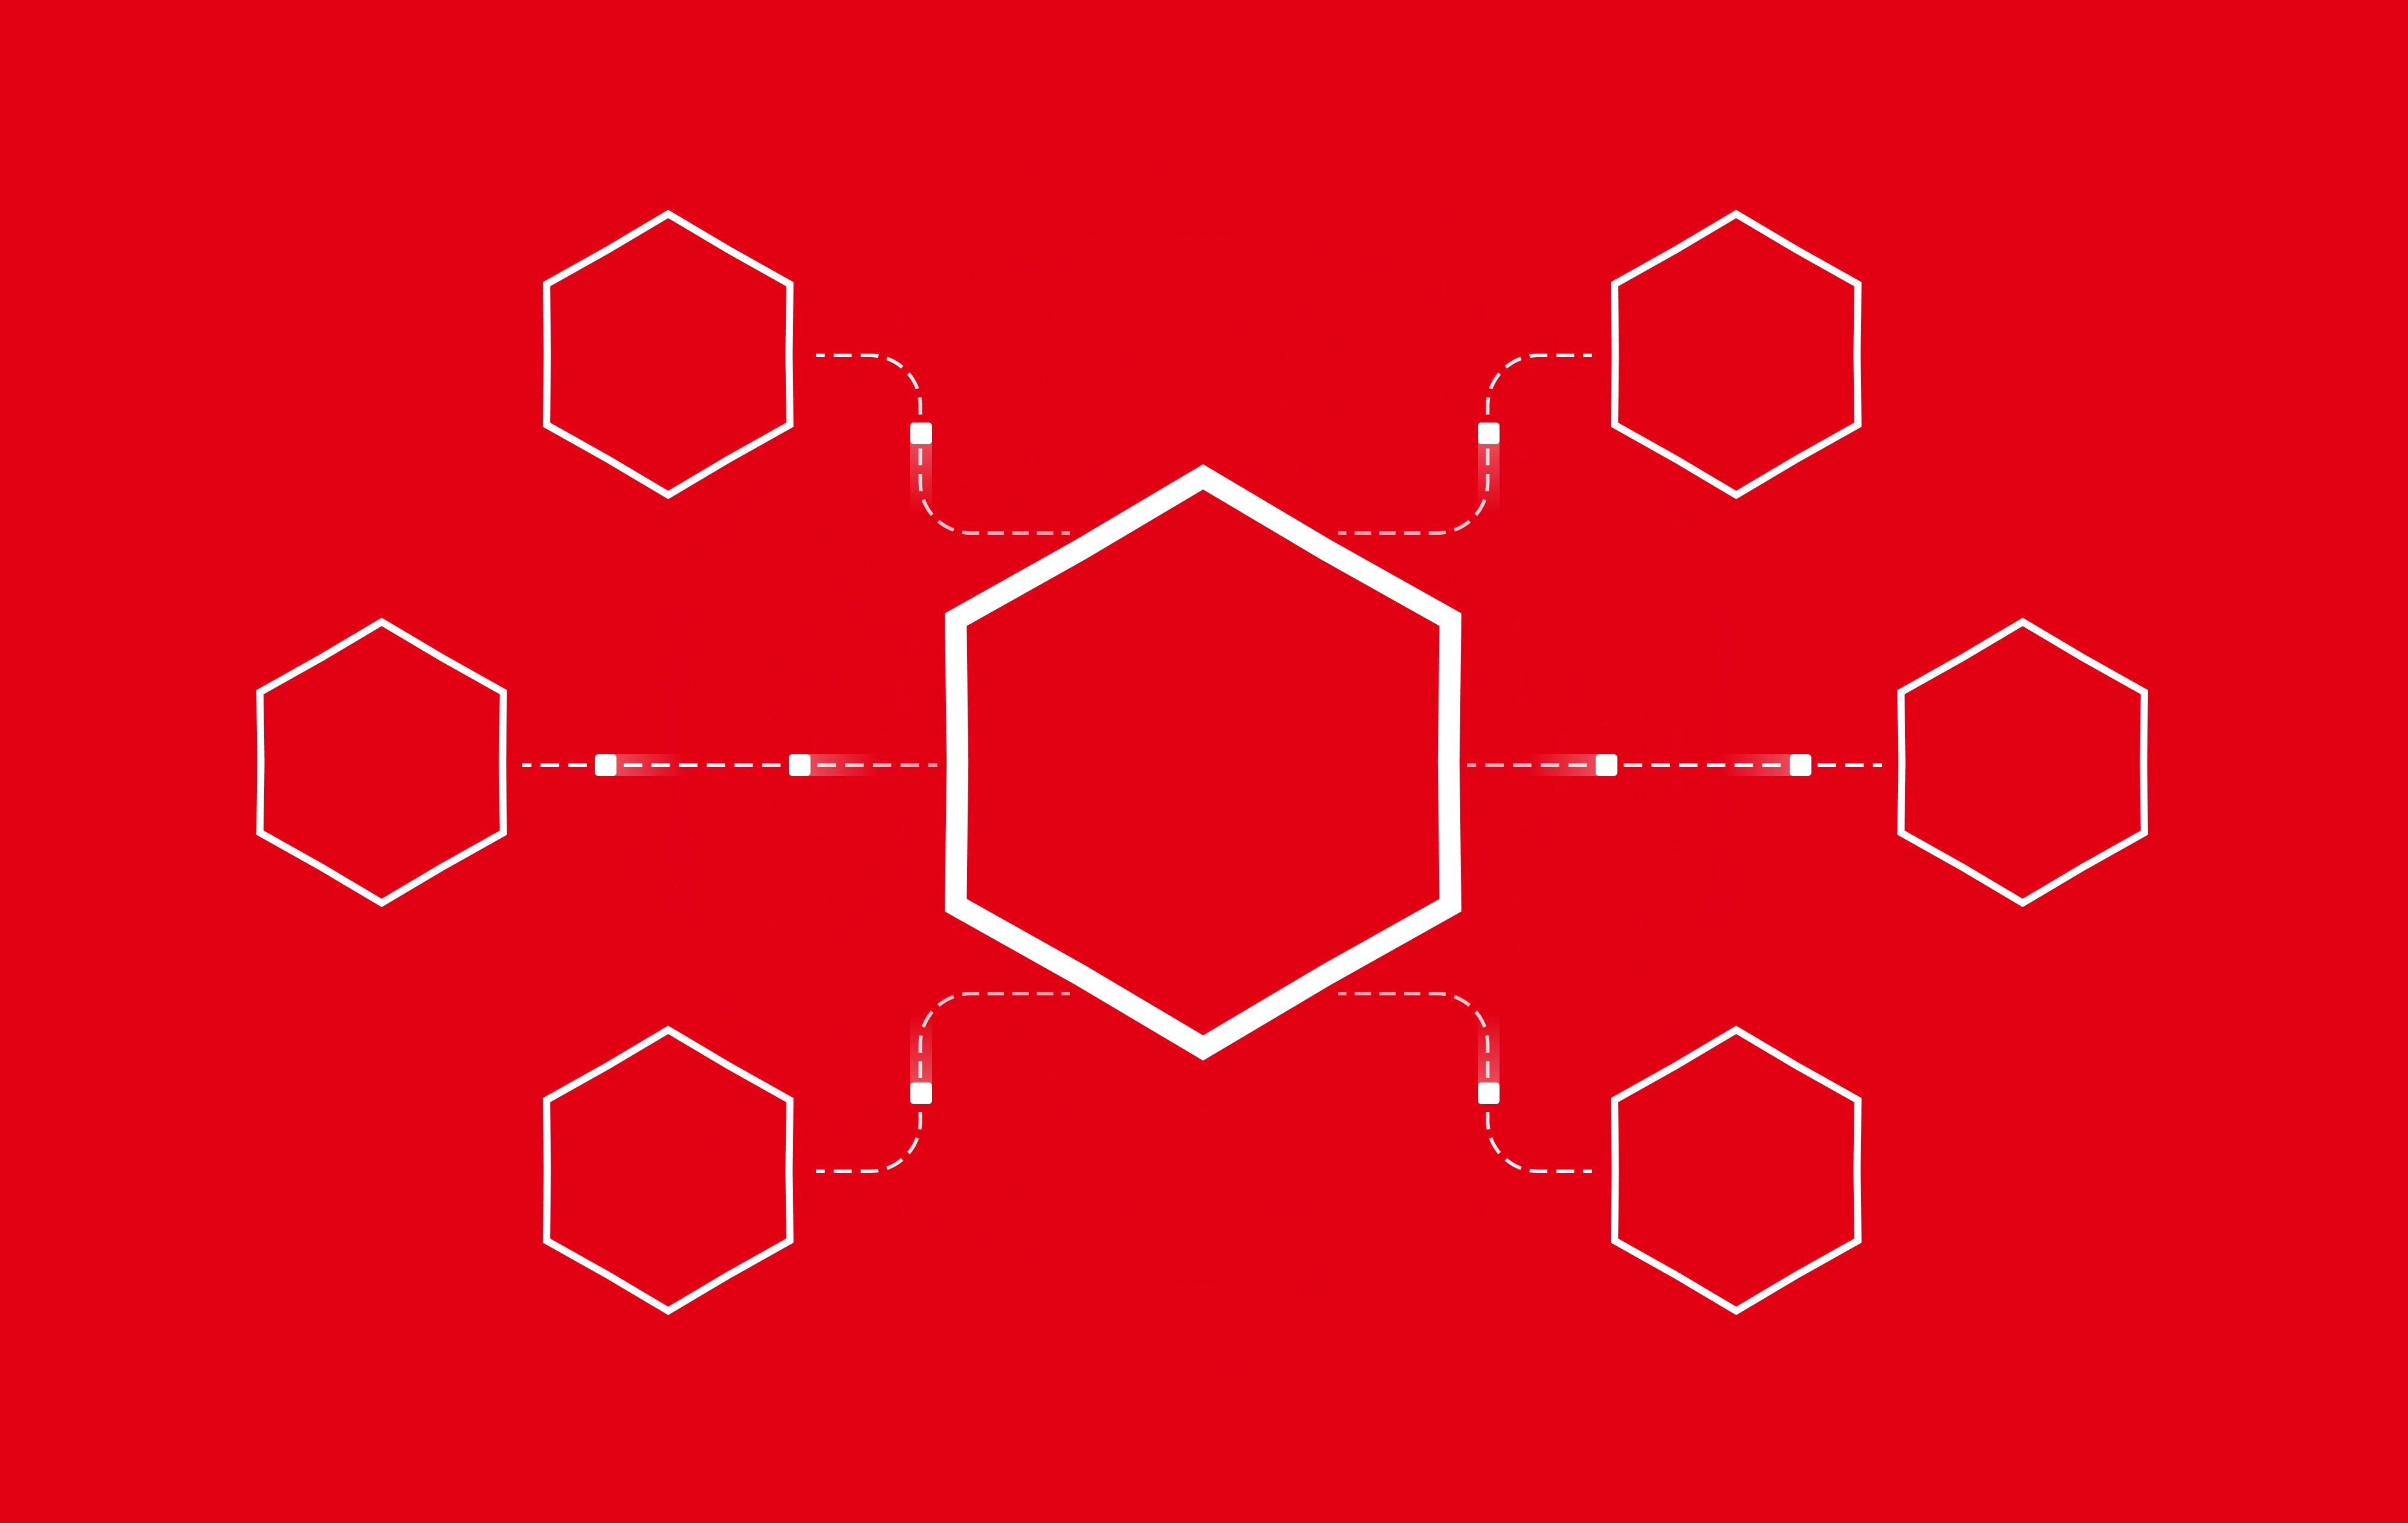
Faros offers an Engineering World Model that integrates engineering semantics, operational data, and token flow into a live graph, connecting tickets, agent sessions, commits, pull requests, and CI verdicts. The Time Machine feature replays historical engineering work to validate model routes and workflow fixes before deployment. The Policy Engine manages organizational policies, budgets, quotas, approved models, and routing rules, enforcing them across gateways and harnesses with a full audit trail. Faros also integrates with over 60 engineering data sources out of the box. Note: Faros’s advanced features may require integration with supported data sources; unsupported tools may limit functionality.
How does Faros help organizations optimize AI engineering workflows?
Faros enables organizations to ship production code faster by validating model routes and workflow fixes using historical engineering data. It reduces token waste by identifying cost-effective models and workflows, and provides benchmarking tools to visualize spend concentration. The Time Machine feature ensures that changes are validated before deployment, eliminating inefficiencies and supporting compliance-heavy industries. Note: Faros’s optimization is most effective when historical engineering data is available for analysis.
What integrations does Faros support?
Faros connects to over 60 engineering data sources, including builder desktops and agents, gateways, source control platforms (GitHub, GitLab, Bitbucket), ticketing systems (Jira, Trello), CI/CD pipelines (Jenkins, CircleCI, Travis CI), and incident management platforms (PagerDuty, Opsgenie). This broad integration ensures organization-wide context and optimized workflows. Note: Integration with unsupported or proprietary tools may require custom development.
Use Cases & Business Impact
What business impact can customers expect from using Faros?
Customers using Faros have reported significant benefits, including a 20%+ throughput increase at a Fortune 100 bank, a 35% velocity gain at a leading identity security provider, and improved productivity and auditability at companies like Autodesk, Coursera, and SmartBear. Faros helps reduce token waste, improve engineering efficiency, and provide actionable insights into AI ROI. Note: Actual results may vary depending on organizational context and data quality.
Can you share specific examples of how Faros addresses engineering pain points?
Faros addresses exploding token bills by running its Time Machine on real engineering tasks, achieving up to 50% reduction in cost per task. Coursera used Faros to articulate engineering vision and track metrics, while Autodesk leveraged it to understand productivity changes. SmartBear ensured effective resource usage and compliance with Faros. These case studies demonstrate tangible improvements in cost, productivity, and compliance. Note: Results depend on the extent of Faros adoption and integration.
Who are the typical users and industries that benefit from Faros?
Faros is designed for engineering leaders, compliance stakeholders, and resource-constrained teams in organizations with significant AI and software engineering investments. It is particularly beneficial for companies in software development, online education, software testing, financial services, and cybersecurity, as shown in case studies with Autodesk, Coursera, SmartBear, and a Fortune 100 bank. Note: Faros may be less suitable for organizations without complex engineering workflows or minimal AI investment.
Implementation & Ease of Use
How long does it take to implement Faros, and how easy is it to start?
Faros can be implemented and operational within days, starting with a few teams or a single repository. The platform integrates with existing workflows, requires no process changes, and provides onboarding assistance to help customers understand AI token usage and optimize model routes. Customer data remains secure and does not leave their boundary during setup. Note: Implementation speed may vary based on organizational complexity and integration requirements.
Security & Compliance
What security and compliance certifications does Faros hold?
Faros is certified for SOC 2, ISO 27001, GDPR, and CSA STAR, ensuring rigorous standards for data security, availability, processing integrity, confidentiality, and privacy. The platform offers enterprise-grade security features, granular access control, and secure deployment options (SaaS, hybrid, or on-premises). Detailed security documentation is available at the Faros Trust Center. Note: For highly specialized compliance needs, consult Faros’s security documentation or contact sales.
Where can I find technical documentation on Faros’s security and compliance practices?
Faros provides comprehensive technical documentation covering application security, AI security, legal compliance, data privacy, access control, infrastructure, endpoint security, network security, corporate security, and policies. This information is available at the Faros Security Portal: security.faros.ai. Note: Some documentation may require authorized access.
Pricing & Plans
What is Faros’s pricing model?
Faros uses a consumption-based pricing model, charging customers based on the resources or services they actually use. This approach provides flexibility and scalability, allowing organizations to align costs with usage. Note: Detailed pricing information is not publicly documented; contact Faros sales for a custom quote.
Competition & Comparison
How does Faros compare to DX, Jellyfish, LinearB, and Opsera?
Faros differs from DX, Jellyfish, LinearB, and Opsera in several key ways:
- Market leadership: Faros launched AI impact analysis in October 2023 and publishes landmark research, while competitors are newer to AI metrics.
- Scientific accuracy: Faros uses ML and causal methods for true impact analysis; competitors provide surface-level correlations.
- Active guidance: Faros offers actionable, team-specific recommendations and gamification, while competitors rely on passive dashboards.
- Comprehensive metrics: Faros tracks velocity, quality, security, satisfaction, and business metrics, not just coding speed.
- Customization: Faros balances out-of-the-box features with deep customization; competitors are more rigid.
- Enterprise readiness: Faros is certified for SOC 2, ISO 27001, GDPR, and CSA STAR, and is available on major cloud marketplaces; Opsera is SMB-only.
- Developer experience: Faros integrates with Copilot Chat and provides AI-powered developer surveys.
Note: Competitors may be preferable for organizations with simpler needs or those already standardized on their platforms.
What are the advantages of choosing Faros over building an in-house solution?
Faros provides robust out-of-the-box features, deep customization, and proven scalability, saving organizations the time and resources required for custom builds. Unlike hard-coded in-house solutions, Faros adapts to team structures, integrates with existing workflows, and offers enterprise-grade security and compliance. Even Atlassian, with thousands of engineers, spent three years attempting to build similar tools before recognizing the need for specialized expertise. Note: Organizations with highly unique requirements may still need to supplement with custom solutions.
Limitations & Fit
Are there any limitations or scenarios where Faros may not be the best fit?
Faros is best suited for organizations with complex engineering workflows, significant AI investments, and a need for compliance and auditability. It may be less suitable for small teams, organizations with minimal AI usage, or those requiring integrations with unsupported proprietary tools. Detailed limitations are not publicly documented; ask Faros sales for specifics.
.webp)

.webp)
.webp)
.webp)
.webp)


.webp)
.webp)

.webp)
.webp)
.webp)
.webp)